

Integrated analysis of copy number alteration and RNA expression profiles of cancer using a high-resolution whole-genome oligonucleotide array
- PMID: 19322034
- PMCID: PMC2721143
- DOI: 10.3858/emm.2009.41.7.051
Integrated analysis of copy number alteration and RNA expression profiles of cancer using a high-resolution whole-genome oligonucleotide array
Abstract
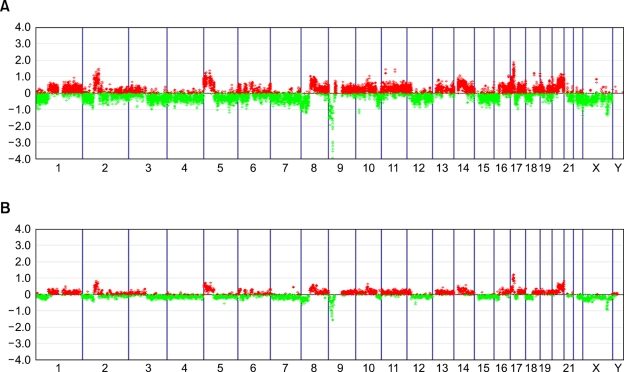
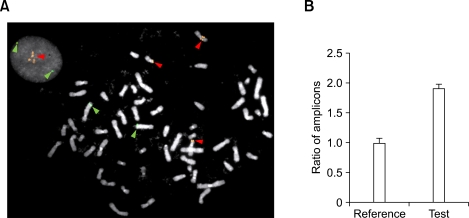
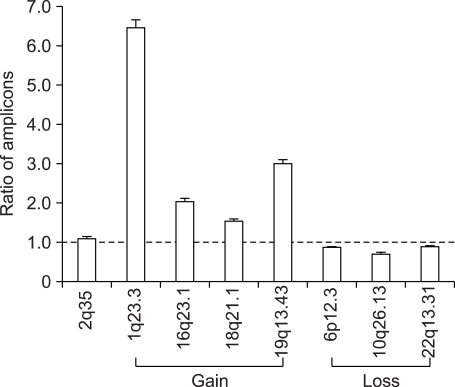
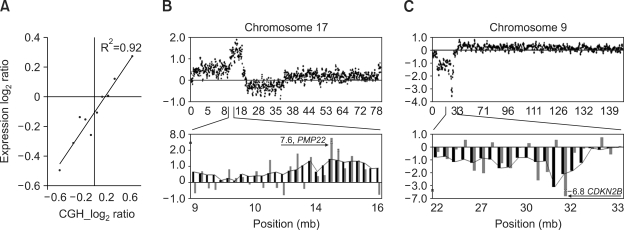
Recently, microarray-based comparative genomic hybridization (array-CGH) has emerged as a very efficient technology with higher resolution for the genome-wide identification of copy number alterations (CNA). Although CNAs are thought to affect gene expression, there is no platform currently available for the integrated CNA-expression analysis. To achieve high-resolution copy number analysis integrated with expression profiles, we established human 30k oligoarray-based genome-wide copy number analysis system and explored the applicability of this system for integrated genome and transcriptome analysis using MDA-MB-231 cell line. We compared the CNAs detected by the oligoarray with those detected by the 3k BAC array for validation. The oligoarray identified the single copy difference more accurately and sensitively than the BAC array. Seventeen CNAs detected by both platforms in MDA-MB-231 such as gains of 5p15.33-13.1, 8q11.22-8q21.13, 17p11.2, and losses of 1p32.3, 8p23.3-8p11.21, and 9p21 were consistently identified in previous studies on breast cancer. There were 122 other small CNAs (mean size 1.79 mb) that were detected by oligoarray only, not by BAC-array. We performed genomic qPCR targeting 7 CNA regions, detected by oligoarray only, and one non-CNA region to validate the oligoarray CNA detection. All qPCR results were consistent with the oligoarray-CGH results. When we explored the possibility of combined interpretation of both DNA copy number and RNA expression profiles, mean DNA copy number and RNA expression levels showed a significant correlation. In conclusion, this 30k oligoarray-CGH system can be a reasonable choice for analyzing whole genome CNAs and RNA expression profiles at a lower cost.
Figures
Similar articles
-
Integration of transcript expression, copy number and LOH analysis of infiltrating ductal carcinoma of the breast.BMC Cancer. 2010 Aug 27;10:460. doi: 10.1186/1471-2407-10-460. BMC Cancer. 2010. PMID: 20799942 Free PMC article.
-
Combined array-comparative genomic hybridization and single-nucleotide polymorphism-loss of heterozygosity analysis reveals complex genetic alterations in cervical cancer.BMC Genomics. 2007 Feb 20;8:53. doi: 10.1186/1471-2164-8-53. BMC Genomics. 2007. PMID: 17311676 Free PMC article.
-
High-resolution analysis of DNA copy number alterations and gene expression in renal clear cell carcinoma.J Pathol. 2007 Dec;213(4):392-401. doi: 10.1002/path.2239. J Pathol. 2007. PMID: 17922474
-
Characterisation of hairy cell leukaemia by tiling resolution array-based comparative genome hybridisation: a series of 13 cases and review of the literature.Eur J Haematol. 2010 Jan 1;84(1):17-25. doi: 10.1111/j.1600-0609.2009.01334.x. Eur J Haematol. 2010. PMID: 19682064 Review.
-
[Analysis of genomic copy number alterations of malignant lymphomas and its application for diagnosis].Gan To Kagaku Ryoho. 2007 Jul;34(7):975-82. Gan To Kagaku Ryoho. 2007. PMID: 17637530 Review. Japanese.
Cited by
-
Simultaneous copy number gains of NUPR1 and ERBB2 predicting poor prognosis in early-stage breast cancer.BMC Cancer. 2012 Aug 31;12:382. doi: 10.1186/1471-2407-12-382. BMC Cancer. 2012. PMID: 22938721 Free PMC article.
-
Comparative genomic hybridization and transcriptome sequencing reveal that two genes, OsI_14279 (LOC_Os03g62620) and OsI_10794 (LOC_Os03g14950) regulate the mutation in the γ-rl rice mutant.Physiol Mol Biol Plants. 2017 Oct;23(4):745-754. doi: 10.1007/s12298-017-0460-9. Epub 2017 Aug 22. Physiol Mol Biol Plants. 2017. PMID: 29158625 Free PMC article.
-
Iodothyronine deiodinases and cancer.J Endocrinol Invest. 2011 Oct;34(9):716-28. doi: 10.3275/7754. Epub 2011 May 27. J Endocrinol Invest. 2011. PMID: 21623154 Review.
-
SCCRO3 (DCUN1D3) antagonizes the neddylation and oncogenic activity of SCCRO (DCUN1D1).J Biol Chem. 2014 Dec 12;289(50):34728-42. doi: 10.1074/jbc.M114.585505. Epub 2014 Oct 27. J Biol Chem. 2014. PMID: 25349211 Free PMC article.
-
Rapid evolution and copy number variation of primate RHOXF2, an X-linked homeobox gene involved in male reproduction and possibly brain function.BMC Evol Biol. 2011 Oct 12;11:298. doi: 10.1186/1471-2148-11-298. BMC Evol Biol. 2011. PMID: 21988730 Free PMC article.
References
-
- Albertson DG, Pinkel D. Genomic microarrays in human genetic disease and cancer. Hum Mol Genet. 2003;12:R145–R152. - PubMed
-
- Brennan C, Zhang Y, Leo C, Feng B, Cauwels C, Aguirre AJ, Kim M, Protopopov A, Chin L. High-resolution global profiling of genomic alterations with long oligonucleotide microarray. Cancer Res. 2004;64:4744–4748. - PubMed
-
- Chin K, DeVries S, Fridlyand J, Spellman PT, Roydasgupta R, Kuo WL, Lapuk A, Neve RM, Qian Z, Ryder T, Chen F, Feiler H, Tokuyasu T, Kingsley C, Dairkee S, Meng Z, Chew K, Pinkel D, Jain A, Ljung BM, Esserman L, Albertson DG, Waldman FM, Gray JW. Genomic and transcriptional aberrations linked to breast cancer pathophysiologies. Cancer Cell. 2006;10:529–541. - PubMed
-
- Croce CM. Oncogenes and cancer. N Engl J Med. 2008;358:502–511. - PubMed
Publication types
MeSH terms
Substances
LinkOut - more resources
Full Text Sources
Medical
Miscellaneous