. 2009 May 6;28(9):1271-82.
doi: 10.1038/emboj.2009.67. Epub 2009 Mar 26.

Ubiquitin-mediated proteolysis of HuR by heat shock

Affiliations

Ubiquitin-mediated proteolysis of HuR by heat shock

Kotb Abdelmohsen et al. EMBO J. .

Abstract

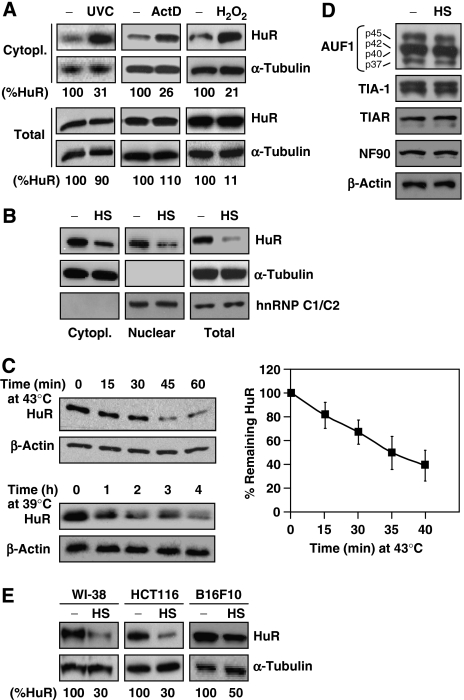
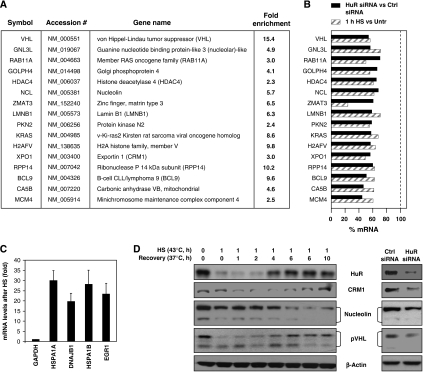
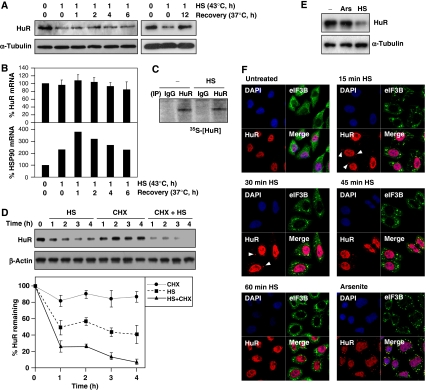
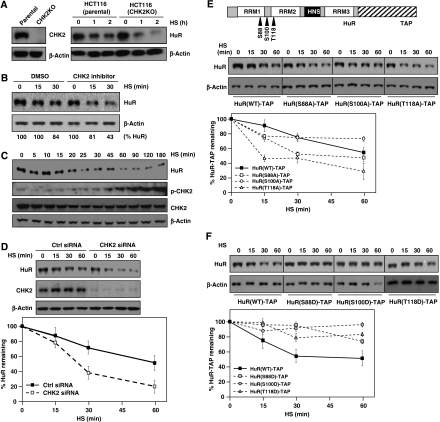
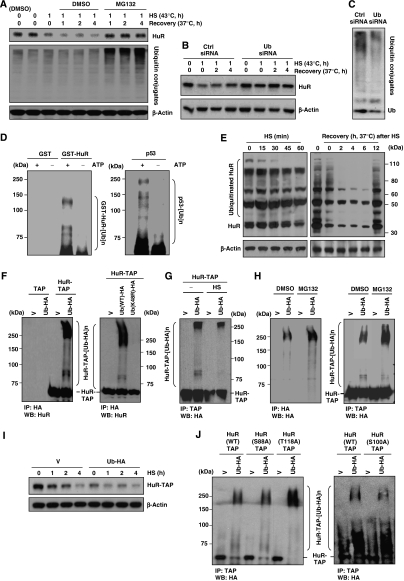
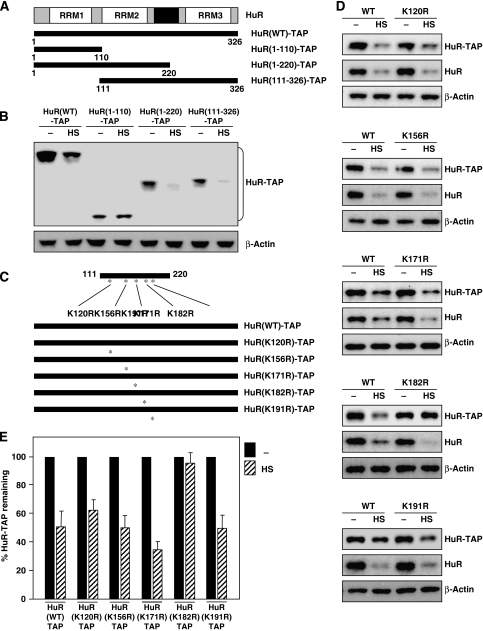
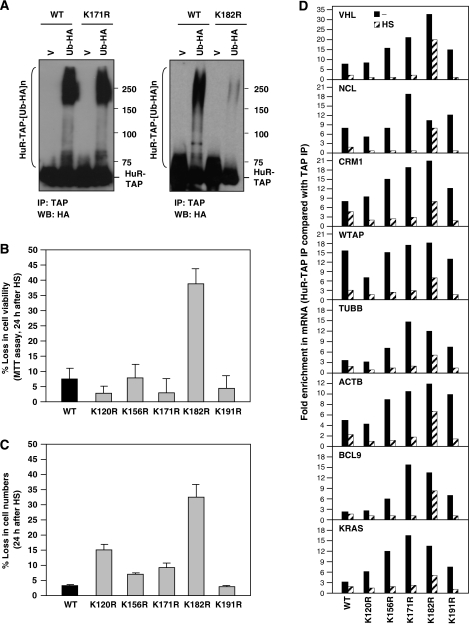
The RNA-binding protein HuR regulates the stability and translation of numerous mRNAs encoding stress-response and proliferative proteins. Although its post-transcriptional influence has been linked primarily to its cytoplasmic translocation, here we report that moderate heat shock (HS) potently reduces HuR levels, thereby altering the expression of HuR target mRNAs. HS did not change HuR mRNA levels or de novo translation, but instead reduced HuR protein stability. Supporting the involvement of the ubiquitin-proteasome system in this process were results showing that (1) HuR was ubiquitinated in vitro and in intact cells, (2) proteasome inhibition increased HuR abundance after HS, and (3) the HuR kinase checkpoint kinase 2 protected against the loss of HuR by HS. Within a central, HS-labile approximately 110-amino-acid region, K182 was found to be essential for HuR ubiquitination and proteolysis as mutant HuR(K182R) was left virtually unubiquitinated and was refractory to HS-triggered degradation. Our findings reveal that HS transiently lowers HuR by proteolysis linked to K182 ubiquitination and that HuR reduction enhances cell survival following HS.


Figures

Figure 1
Figure 1
Decline in HuR levels following heat shock. (A) HeLa cells were treated with UVC (20 J/m2, collected 4 h later), with actinomycin D (ActD, 2 μg/ml for 1 h), or with H2O2 (1 mM, 3 h). The levels of HuR and loading control α-Tubulin in whole-cell (Total, 2.5 μg) and cytoplasmic (Cytopl., 5 μg) lysates were assessed by western blot analysis. (B) Cells were treated with heat shock (HS, 43°C) for 1 h, whereupon Cytopl. (5 μg), Nuclear (2.5 μg), and Total (2.5 μg) lysates were prepared and the levels of HuR and the cytoplasmic (α-Tubulin) and nuclear (hnRNP C1/C2) markers were tested by western blot analysis. (C) Kinetics of HuR reduction after HS at 43°C (top) and 39°C (bottom); graph, means±s.d. (n>3) of HuR signals after HS at 43°C. (D) Effect of HS (43°C, 1 h) on the levels of the RNA-binding proteins shown (whole-cell lysates); four AUF1 isoforms are indicated; β-actin was included as loading control. (E) Effect of HS (43°C, 1 h) on the levels of HuR and loading control α-Tubulin in human and mouse cell lines. % HuR, densitometric analysis of signals from HuR and loading control proteins.
Figure 2
Figure 2
Analysis of HuR target mRNAs after HS. Microarray analyses were performed to identify HuR-associated mRNAs (Supplementary Table I) and mRNAs showing altered levels after HS (1 h, 43°C) (Supplementary Tables II and III). (A, B) The mRNAs listed (shown to be associated with HuR and to decrease after HS by array analysis) were validated using RT-qPCR and specific primer pairs; the individual enrichment of each mRNA in anti-HuR IPs compared with IgG IPs is indicated [Fold Enrichment, (A)], and the influence of HS (relative to no treatment) and the influence of HuR silencing by siRNA transfection (relative to control Ctrl siRNA transfection) were quantified [% mRNA, (B)]. (C) The levels of control HS-inducible mRNAs were tested by RT-qPCR to monitor the effectiveness of the HS conditions. (D) Left, Western blot analysis of the levels of proteins encoded by HuR target mRNAs showing reduction after HS (CRM1, Nucleolin, pVHL) and loading marker β-actin. Protein levels were monitored after 1 h at 43°C and several time points after HS as at 37°C (Recovery). Right, protein levels by 48 h after transfecting cells with control (Ctrl) or HuR-directed siRNAs.
Figure 3
Figure 3
HS transiently localizes HuR in SGs and reduces HuR protein stability. (A) HeLa cells were subjected to HS (1 h) or no treatment, whereupon they were collected or returned to 37°C for the times shown (Recovery); the levels of HuR and α-Tubulin in whole-cell lysates were tested by western blot analysis. (B) The levels of HuR mRNA or the control HS-inducible HSP90 mRNA were measured by RT-qPCR at the times shown in cells that were treated with HS with or without recovery as explained in panel (A). (C) Influence of HS on the de novo HuR translation (35S-[HuR]). (D) The levels of HuR were measured in cells treated with HS (HS), incubated with 10 μg/ml cycloheximide (CHX), or exposed to HS in the presence of CHX (CHX + HS). The levels of HuR and loading control β-actin were measured by western blot analysis. (E) Western blot analysis of HuR expression levels in whole-cell lysates prepared from cells that were treated with sodium arsenite (Ars, 400 μM, 30 min, as positive control) or HS (43°C, 1 h). (F) Cells were treated as in panel (E), and the presence of stress granules (SGs, arrowheads) was assessed by immunofluorescence at the times shown after HS or arsenite treatments. Nuclei were visualized using DAPI, and SGs with the specific marker eIF3B; the overlap of the two signals (Merge) is shown.
Figure 4
Figure 4
CHK2 reduces HuR loss by HS. (A) Western blot analysis of the levels of CHK2, HuR, and loading control in untreated (left) or HS-treated (43°C, right) colon carcinoma HCT116 cells expressing CHK2 (Parental) or CHK2-null through somatic knockout (CHK2KO). (B) Western blot analysis of HuR and β-actin expression levels in HeLa cells pre-treated with a CHK2 inhibitor (10 μM, 1 h), then exposed to HS for the times indicated; signal intensities were quantified by densitometry. (C) Western blot analysis of the levels of HuR, phosphorylated (p-)CHK2, total CHK2, and β-actin in HeLa cells treated with HS for the times indicated. (D) At 48 h after transfection of CHK2-directed or control (Ctrl) siRNAs, HeLa cells were treated with HS for the times shown and the levels of HuR, CHK2, and loading control β-actin were assessed by western blot analysis. In panels (D–F), the western blotting signals were quantified by densitometry and the means ±s.d. from three independent experiments are shown. (E) Top, schematic of the sites of CHK2 phosphorylation on HuR. By 48 h after transfection of plasmids to express HuR–TAP fusion proteins [WT or bearing mutations in putative CHK2 phosphorylation sites (S88A, S100A, T118A)], the levels of HuR–TAP fusion proteins were assessed by western blotting. (F) By 48 h after transfection of plasmids to express HuR–TAP fusion proteins [WT or bearing phosphomimic mutations (S88D, S100D, T118D)], HuR–TAP fusion protein levels were assessed as explained in (E).
Figure 5
Figure 5
Analysis of HuR ubiquitination in vitro and in vivo. (A) The levels of HuR, ubiquitinated proteins, and loading control β-actin were studied by western blot analysis in cells that were treated (temperatures and times) as shown, in the presence of MG132 (20 μM) or vehicle control (DMSO). (B) At 48 h after transfecting either control (Ctrl) siRNA or a ubiquitin-targeting (Ub) siRNA, HuR and loading control β-actin were assessed in cells incubated as shown. (C) Western blot analysis of the levels of ubiquitin and total ubiquitin-conjugated proteins 48 h after transfection with Ctrl or Ub siRNAs. (D) Left, in vitro polyubiquitination of HuR was measured using a control protein (GST) and a GST-HuR fusion protein in the absence or presence of ATP; Right, in vitro polyubiquitination of purified p53; kDa, sizes of molecular weight markers. (E) Western blot analysis (modified as detailed in the Supplementary data) of endogenous ubiquitinated HuR after treatment of HeLa cells with HS (left) and during recovery from HS (right). (F) Left, HeLa cells were cotransfected with a plasmid expressing an HA-tagged ubiquitin (Ub-HA) or the corresponding control vector (V), together with a plasmid expressing either HuR–TAP or the vector control (TAP); polyubiquitinated HuR–TAP was assessed 48 h later by HA IP, followed by HuR western blot (WB) analysis. Right, cells were processed as shown on the left of panel (F), but a mutant variant of ubiquitin that cannot oligomerize [Ub(K48R)-HA] was also tested; polyubiquitinated HuR–TAP was assessed 48 h later by HA IP, followed by HuR WB analysis. (G) Cells cotransfected with HuR–TAP along with either Ub-HA-expressing or V plasmids were left without further treatment or were treated with HS (43°C for 15 min), whereupon the levels of ubiquitinated HuR–TAP were detected by TAP IP (using Rabbit IgG) and WB analysis using an anti-HA antibody. (H) Left, in cells transfected with Ub-HA-expressing plasmid, Ub-HA levels were tested in the absence (DMSO) or presence of MG132 (20 μM for 4 h) by IP using an anti-HA antibody, followed by HA detection by WB. Right, cells co-transfected with pHuR–TAP and Ub-HA were used to detect the levels of ubiquitinated HuR–TAP in the absence (DMSO) or presence of MG132 (20 μM for 4 h) after TAP IP (using rabbit IgG), and then to detect Ub using an anti-HA antibody. (I) HuR abundance in cells expressing normal ubiquitin levels or overexpressing ubiquitin as HA-Ub; protein levels were studied at the times shown following HS. (J) The ubiquitination of HuR–TAP fusion proteins bearing point mutations S88A and S118A (left) or S100A (right) was tested by cotransfection of plasmids as explained for panel (F), except that the HuR mutants tested were those described in Figure 4E. Protein signals were visualized by TAP IP, followed by WB analysis using an anti-HA antibody.
Figure 6
Figure 6
HuR ubiquitination and degradation by HS requires Lys-182. (A) Schematic of truncated HuR segments (generated from HuR–TAP). (B) The effect of HS on the levels of the HuR segments shown in (A) were tested by measuring HuR–TAP signals on western blots using an anti-IgG antibody to recognize the TAP segments of the fusion proteins. (C) Schematic of the point mutations [Lys → Arg (K → R)] introduced into the five lysine residues within the labile region of HuR–TAP. (D) The relative stability of each HuR–TAP (K → R) mutant was tested by western blot analysis; the levels of endogenous HuR, HuR–TAP (WT relative to K120R, K156R, K171R, K182R or K191R), and loading control β-actin were tested by monitoring HuR signals in untreated (−) compared with HS-treated (HS) cells. (E) Quantification of the western blotting data shown in (D); data represent the means±s.d. from three independent experiments.
Figure 7
Figure 7
In vivo ubiquitination of HuR–TAP and mutant TAP and influence on cell survival after HS. (A) Cells were transfected with HuR–TAP (WT), HuR–TAP (K171R) (left), or HuR–TAP (K182R) (right) along with V or Ub-HA-expressing plasmids. The levels of ubiquitinated HuR–TAP were detected by IP (using Rabbit IgG) followed by WB analysis using anti-HA antibody. (B, C) Cells were transfected with plasmids to overexpress the HuR–TAP fusion proteins shown [WT (black) and K → R mutants (gray)]; 48 h later, cells were subjected to HS (43°C, 1 h), and after an additional 24 h the surviving fraction was quantified using the MTT assay (B) or by direct cell counts (C). The loss in cell viability and numbers was represented as a percentage of untreated cells in each transfection group (means±s.d. from three independent experiments). (D) In cells transfected as described in panels (B, C), the association of each HuR–TAP chimeric protein with HuR target transcripts was tested by RNP IP. The fold enrichment represents mRNA association to each HuR–TAP relative to TAP; the average of two similar experiments is shown.

References

    1. Abdelmohsen K, Kuwano Y, Kim HH, Gorospe M (2008) Posttranscriptional gene regulation by RNA-binding proteins during oxidative stress: implications for cellular senescence. Biol Chem 389: 243–255 - PMC - PubMed
    1. Abdelmohsen K, Lal A, Kim HH, Gorospe M (2007b) Posttranscriptional orchestration of an anti-apoptotic program by HuR. Cell Cycle 6: 1288–1292 - PubMed
    1. Abdelmohsen K, Pullmann R Jr, Lal A, Kim HH, Galban S, Yang X, Blethrow JD, Walker M, Shubert J, Gillespie DA, Furneaux H, Gorospe M (2007a) Phosphorylation of HuR by Chk2 regulates SIRT1 expression. Mol Cell 25: 543–557 - PMC - PubMed
    1. Bhattacharyya SN, Habermacher R, Martine U, Closs EI, Filipowicz W (2006) Relief of microRNA-mediated translational repression in human cells subjected to stress. Cell 125: 1111–1124 - PubMed
    1. Bonelli MA, Alfieri RR, Desenzani S, Petronini PG, Borghetti AF (2004) Proteasome inhibition increases HuR level, restores heat-inducible HSP72 expression and thermotolerance in WI-38 senescent human fibroblasts. Exp Gerontol 39: 423–432 - PubMed

Publication types

MeSH terms