Direct sampling from human liver tissue cross sections for electrophoretic analysis of doxorubicin
- PMID: 19323500
- PMCID: PMC2675659
- DOI: 10.1021/ac802542e
Direct sampling from human liver tissue cross sections for electrophoretic analysis of doxorubicin
Abstract
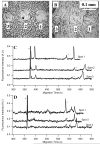
After chemoembolization of the liver with doxorubicin (Dox), this drug and its metabolites are not homogeneously distributed in this organ. The distribution cannot be easily measured making it difficult to assess how the drug performs in different tissue regions. Here we report a technique for sampling tissue cross sections that can analyze the contents of micrometer size regions. The tissue cross sections were from the explanted liver of a hepatocellular carcinoma patient. Samples were directly aspirated from a 5 microm thick tissue cross section into a 50 microm i.d. capillary where the tissue was solubilized with a separation buffer containing sodium dodecyl sulfate. Upon sample dissolution, Dox and natively fluorescent compounds were separated and detected by micellar electrokinetic chromatography with laser-induced fluorescence detection. Sampling reproducibility and recovery were assessed using 10% (w/v) gelatin as tissue mimic. Sampling from gelatin slices containing Dox revealed a relative standard deviation of 13%, which was comparable to that of sampling from solution. Dox recovery was 82% +/- 16% (n = 5). When sampling tumor and nontumor tissue regions, samples could be taken from the same region 100 microm apart. Atomic force microscopy was used to determine that each sample was 8.4 +/- 1.0 pL in volume which made it possible to determine Dox concentrations in the ranges of 0.4-1.3 and 0.3-0.5 microM for the samples taken from tumor and nontumor regions, respectively. The results demonstrated the feasibility of sampling, detection, and quantification of Dox in micrometer size regions, which could be a useful resource for analyzing the Dox concentration and distribution in highly heterogeneous tissues.
Figures


Similar articles
-
Measuring the doxorubicin content of single nuclei by micellar electrokinetic capillary chromatography with laser-induced fluorescence detection.Anal Chem. 2005 Jun 1;77(11):3488-93. doi: 10.1021/ac0500378. Anal Chem. 2005. PMID: 15924379
-
Monitoring the subcellular localization of doxorubicin in CHO-K1 using MEKC-LIF: liposomal carrier for enhanced drug delivery.Talanta. 2012 Sep 15;99:683-8. doi: 10.1016/j.talanta.2012.06.077. Epub 2012 Jul 16. Talanta. 2012. PMID: 22967611
-
Ligand-directed reduction-sensitive shell-sheddable biodegradable micelles actively deliver doxorubicin into the nuclei of target cancer cells.Biomacromolecules. 2013 Oct 14;14(10):3723-30. doi: 10.1021/bm401098w. Epub 2013 Sep 16. Biomacromolecules. 2013. PMID: 23998942
-
Separation of doxorubicin and doxorubicinol by cyclodextrin-modified micellar electrokinetic capillary chromatography.Electrophoresis. 2006 Aug;27(16):3263-70. doi: 10.1002/elps.200600025. Electrophoresis. 2006. PMID: 16915573
-
An eco-friendly stability-indicating spectrofluorimetric method for the determination of two anticancer stereoisomer drugs in their pharmaceutical preparations following micellar enhancement: Application to kinetic degradation studies.Spectrochim Acta A Mol Biomol Spectrosc. 2016 Jun 15;163:145-53. doi: 10.1016/j.saa.2016.03.034. Epub 2016 Mar 23. Spectrochim Acta A Mol Biomol Spectrosc. 2016. PMID: 27045788
Cited by
-
Electrophoretic extraction of low molecular weight cationic analytes from sodium dodecyl sulfate containing sample matrices for their direct electrospray ionization mass spectrometry.Anal Chem. 2015 Mar 3;87(5):2702-9. doi: 10.1021/ac503903j. Epub 2015 Feb 19. Anal Chem. 2015. PMID: 25664891 Free PMC article.
-
Confirmation of drug delivery after liver chemoembolization: direct tissue doxorubicin measurement by UHPLC-MS-MS.Biomed Chromatogr. 2012 Dec;26(12):1529-33. doi: 10.1002/bmc.2727. Epub 2012 Mar 27. Biomed Chromatogr. 2012. PMID: 22454282 Free PMC article.
-
Liquid Chromatography-Tandem Mass Spectrometry for the Simultaneous Determination of Doxorubicin and its Metabolites Doxorubicinol, Doxorubicinone, Doxorubicinolone, and 7-Deoxydoxorubicinone in Mouse Plasma.Molecules. 2020 Mar 10;25(5):1254. doi: 10.3390/molecules25051254. Molecules. 2020. PMID: 32164308 Free PMC article.
-
Combination of micellar electrokinetic and high-performance liquid chromatographies to assess age-related changes in the in vitro metabolism of Fischer 344 rat liver.J Gerontol A Biol Sci Med Sci. 2011 Sep;66(9):935-43. doi: 10.1093/gerona/glr074. Epub 2011 Jul 11. J Gerontol A Biol Sci Med Sci. 2011. PMID: 21746738 Free PMC article.
-
3-D printed injection system for capillary electrophoresis.Anal Methods. 2022 Mar 17;14(11):1163-1168. doi: 10.1039/d2ay00075j. Anal Methods. 2022. PMID: 35254370 Free PMC article.
References
-
- Malarkey DE, Johnson K, Ryan L, Boorman G, Maronpot RR. Toxicol. Pathol. 2005;33:27–34. - PubMed
-
- Vona G, Tuveri R, Delpuech O, Vallet A, Canioni D, Ballardini G, Baptiste Trabut J, Le Bail B, Nalpas B, Carnot F, Pol S, Brechot C, Thiers V. J. Hepatol. 2004;40:682–688. - PubMed
-
- Sobesky R, Feray C, Rimlinger F, Derian N, Dos Santos A, Roque-Afonso AM, Samuel D, Brechot C, Thiers V. Hepatology. 2007;46:1704–1712. - PubMed
-
- Venook AP, Stagg RJ, Lewis BJ, Chase JL, Ring EJ, Maroney TP, Hohn DC. J. Clin. Oncol. 1990;8:1108–1114. - PubMed
-
- Reyzer ML, Hsieh Y, Ng K, Korfmacher WA, Caprioli RM. J. Mass. Spectrom. 2003;38:1081–1092. - PubMed
Publication types
MeSH terms
Substances
Grants and funding
LinkOut - more resources
Full Text Sources
Other Literature Sources

