. 2009 Mar 24;6(3):e1000048.
doi: 10.1371/journal.pmed.1000048.

A world malaria map: Plasmodium falciparum endemicity in 2007

Affiliations

A world malaria map: Plasmodium falciparum endemicity in 2007

Simon I Hay et al. PLoS Med. .

Erratum in

  • PLoS Med. 2009 Oct;6(10). doi: 10.1371/annotation/a7ab5bb8-c3bb-4f01-aa34-65cc53af065d

Abstract

Background: Efficient allocation of resources to intervene against malaria requires a detailed understanding of the contemporary spatial distribution of malaria risk. It is exactly 40 y since the last global map of malaria endemicity was published. This paper describes the generation of a new world map of Plasmodium falciparum malaria endemicity for the year 2007.

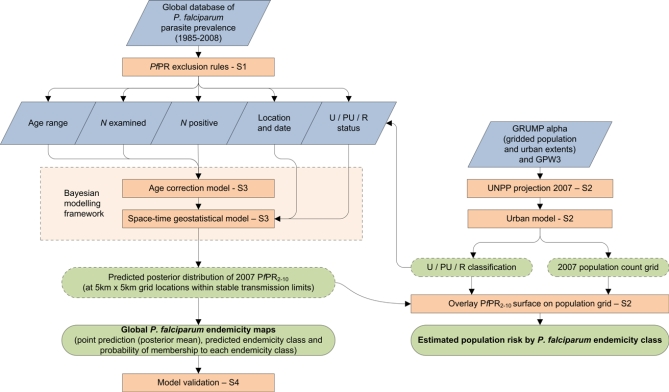
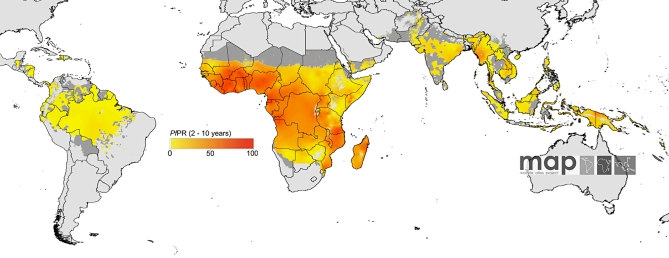
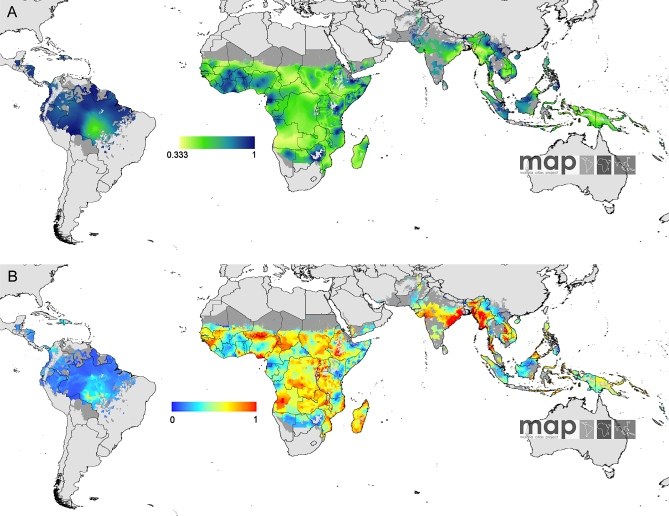
Methods and findings: A total of 8,938 P. falciparum parasite rate (PfPR) surveys were identified using a variety of exhaustive search strategies. Of these, 7,953 passed strict data fidelity tests for inclusion into a global database of PfPR data, age-standardized to 2-10 y for endemicity mapping. A model-based geostatistical procedure was used to create a continuous surface of malaria endemicity within previously defined stable spatial limits of P. falciparum transmission. These procedures were implemented within a Bayesian statistical framework so that the uncertainty of these predictions could be evaluated robustly. The uncertainty was expressed as the probability of predicting correctly one of three endemicity classes; previously stratified to be an informative guide for malaria control. Population at risk estimates, adjusted for the transmission modifying effects of urbanization in Africa, were then derived with reference to human population surfaces in 2007. Of the 1.38 billion people at risk of stable P. falciparum malaria, 0.69 billion were found in Central and South East Asia (CSE Asia), 0.66 billion in Africa, Yemen, and Saudi Arabia (Africa+), and 0.04 billion in the Americas. All those exposed to stable risk in the Americas were in the lowest endemicity class (PfPR2-10 < or = 5%). The vast majority (88%) of those living under stable risk in CSE Asia were also in this low endemicity class; a small remainder (11%) were in the intermediate endemicity class (PfPR2-10 > 5 to < 40%); and the remaining fraction (1%) in high endemicity (PfPR2-10 > or = 40%) areas. High endemicity was widespread in the Africa+ region, where 0.35 billion people are at this level of risk. Most of the rest live at intermediate risk (0.20 billion), with a smaller number (0.11 billion) at low stable risk.

Conclusions: High levels of P. falciparum malaria endemicity are common in Africa. Uniformly low endemic levels are found in the Americas. Low endemicity is also widespread in CSE Asia, but pockets of intermediate and very rarely high transmission remain. There are therefore significant opportunities for malaria control in Africa and for malaria elimination elsewhere. This 2007 global P. falciparum malaria endemicity map is the first of a series with which it will be possible to monitor and evaluate the progress of this intervention process.


Conflict of interest statement

Competing Interests: The authors have declared that no competing interests exist.

Figures

Figure 1
Figure 1. The Spatial Limits of P. falciparum Malaria Risk Defined by PfAPI with Further Medical Intelligence, Temperature, and Aridity Masks
Areas were defined as stable (dark grey areas, where PfAPI ≥ 0.1 per 1,000 pa), unstable (medium grey areas, where PfAPI < 0.1 per 1,000 pa), or no risk (light grey, where PfAPI = 0 per 1,000 pa) [–19]. The community surveys of P. falciparum prevalence conducted between January 1, 1985 and July 31, 2008 are plotted. Of the 8,938 surveys collected, 7,953 satisfied our inclusion criteria for modelling (see Methods and Protocol S1.2) and are shown here. The survey data shown are age-standardized [51] (PfPR2−10) and shown as a continuum of yellow to red from 0%–100% (see map legend). The dashed lines separate the America; Africa+; and the CSE Asia regions.
Figure 2
Figure 2. Schematic Overview of the Mapping Procedures and Methods
Blue diamonds describe input data. Orange boxes denote models and experimental procedures; S1, Protocol S1; S2, Protocol S2; S3, Protocol S3; and S4, Protocol S4. Green rods indicate output data; dashed lines intermediate output, solid lines final outputs. U, urban; PU, peri-urban; and R, rural extents.
Figure 3
Figure 3. The Spatial Distribution of P. falciparum Malaria Endemicity
The data are the model-based geostatistical point estimates of the annual mean PfPR2−10 for 2007 within the stable spatial limits of P. falciparum malaria transmission, displayed as a continuum of yellow to red from 0%–100% (see map legend). The rest of the land area was defined as unstable risk (medium grey areas, where PfAPI < 0.1 per 1,000 pa) or no risk (light grey, where PfAPI = 0 per 1,000 pa) [–19].
Figure 4
Figure 4. The Spatial Distribution of P. falciparum Malaria PfPR2−10 Predictions Stratified by Endemicity Class
They are categorized as low risk PfPR2−10 ≤ 5%, light red; intermediate risk PfPR2−10 > 5% to < 40%, medium red; and high risk PfPR2−10 ≥ 40%, dark red. The map shows the class to which PfPR2−10 has the highest predicted probability of membership. The rest of the land area was defined as unstable risk (medium grey areas, where PfAPI < 0.1 per 1,000 pa) or no risk (light grey) [–19].
Figure 5
Figure 5. Maps of Model Uncertainty
(A) The probability of PfPR2−10 being in the class to which it was assigned is mapped and shown as a yellow to blue continuum from 0.3̇ − 1. Any value above 0.3̇ is better than a chance allocation. The rest of the land area was defined as unstable risk (medium grey areas, where PfAPI < 0.1 per 1,000 pa) or no risk (light grey) [–19]. (B) The population-weighted index of uncertainty. This index shows the likely importance of uncertainty assessed by the product of the log of population density (Protocol S2.3) and the reciprocal of the probability of correct class assignment, rescaled from 0–1. The index is shown for the most probable PfPR2−10 endemicity class. Unstable and no risk are as (A).
Figure 6
Figure 6. Model Validation Plots
(A) Scatter plot of actual versus predicted point-values of PfPR2−10. (B) Sample semi-variogram of standardized model Pearson residuals estimated at discrete lags (circles) and compared to a Monte Carlo envelope (dashed lines) representing the range of values expected by chance in the absence of spatial autocorrelation. (C) Receiver-Operating-Characteristic curves for each PfPR2−10 endemicity class (black line, PfPR2−10 ≤ 5%; red line, PfPR2−10 > 5% to < 40%; green line, PfPR2−10 ≥ 40%) and associated AUC statistics. (D) Probability-probability plot comparing predicted probability thresholds with the actual percentage of true values exceeding those thresholds. In the top left and bottom left plots the 1:1 line is also shown (dashed line) for reference. See text for full explanation of validation procedures and interpretation of results.
Figure 7
Figure 7. Pie Charts Showing the PAR of P. falciparum Malaria in 2007
The charts show the proportion of the population living in each predicted PfPR2−10 endemicity classes for the America, Africa+, CSE Asia regions, and worldwide. The charts are scaled proportionally to the total population at risk in each region and the segments are coloured to match the endemicity classes shown in Figure 4.
Figure 8
Figure 8. Violin Plots Showing for Each Region Frequency Distributions of PfPR2−10 data
(A) For all years, (B) for 2007, and (C) for the predicted 2007 surface. The width of each polygon illustrates the relative frequency of different PfPR2−10 values within each region. The background is coloured to match the endemicity classes shown in Figure 4. The black central bar indicates the inter-quartile range and white circles indicate the median values (see text).

Similar articles

Cited by

References

    1. Hay SI, Snow RW. The Malaria Atlas Project: developing global maps of malaria risk. PLoS Med. 2006;3:e473. doi: 10.1371/journal.pmed.0030473. - DOI - PMC - PubMed
    1. Horton. Is malaria eradication possible. Lancet. 2007;370:1459. - PubMed
    1. Roberts L, Enserink M. Did they really say … eradication. Science. 2007;318:1544–1545. - PubMed
    1. Feachem R, Sabot O. A new global malaria eradication strategy. Lancet. 2008;10:1633–1635. - PubMed
    1. Lysenko AJ, Semashko IN. Geography of malaria. A medico-geographic profile of an ancient disease [in Russian] In: Lebedew AW, editor. Itogi Nauki: Medicinskaja Geografija. Moscow: Academy of Sciences, USSR; 1968. pp. 25–146.

Publication types