

Effects of erythrocyte deformability and aggregation on the cell free layer and apparent viscosity of microscopic blood flows
- PMID: 19323969
- PMCID: PMC2917820
- DOI: 10.1016/j.mvr.2009.01.010
Effects of erythrocyte deformability and aggregation on the cell free layer and apparent viscosity of microscopic blood flows
Abstract
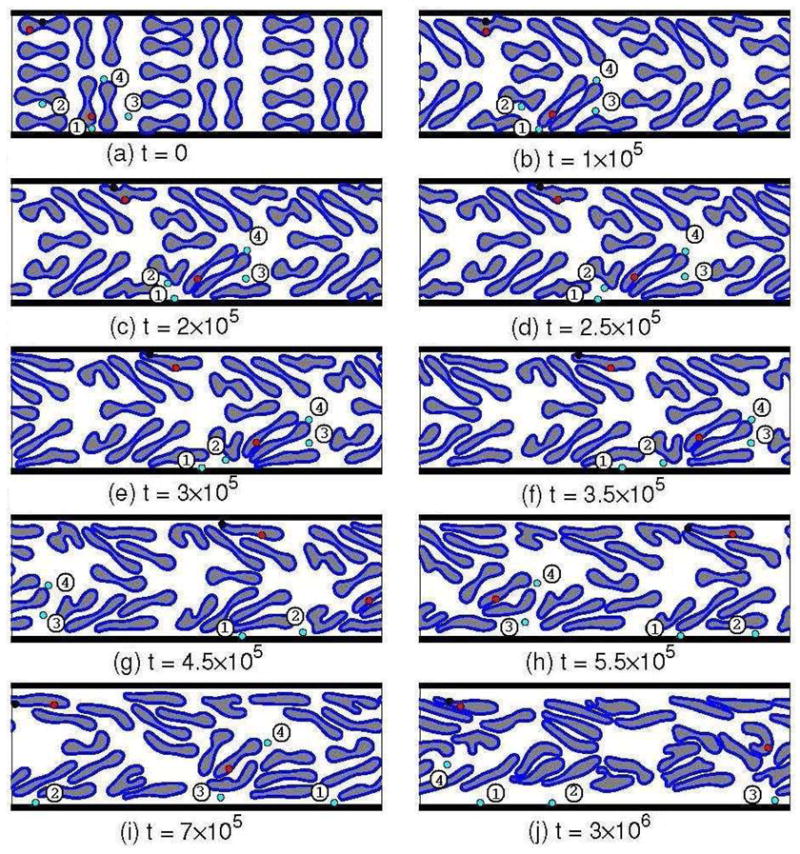
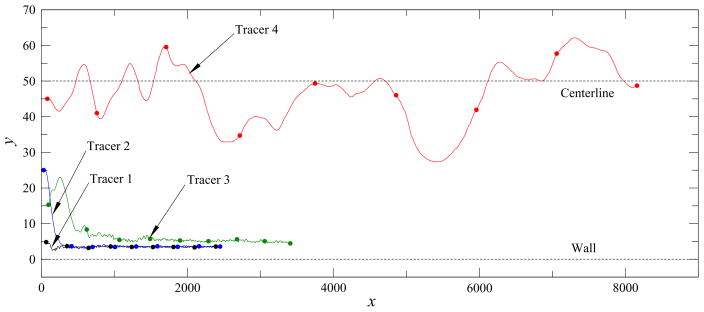
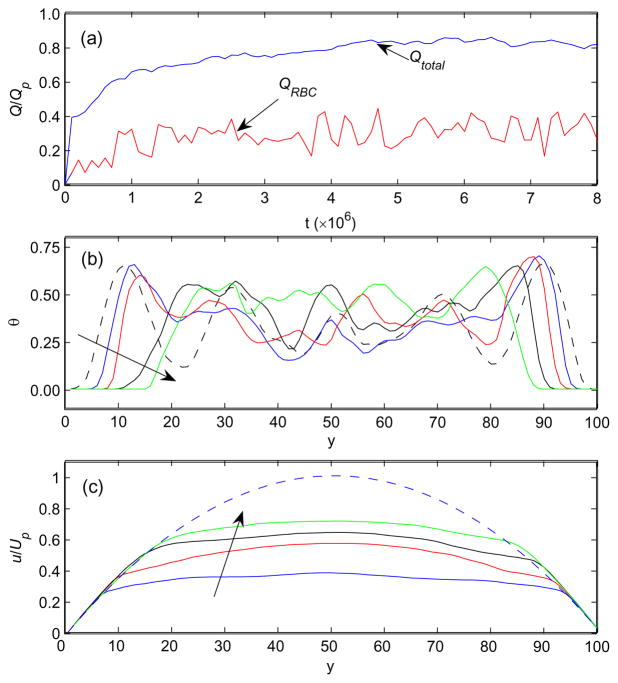
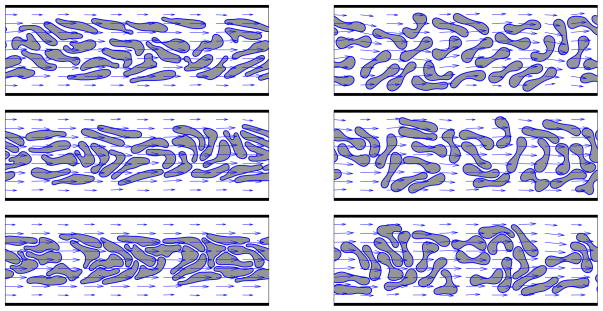
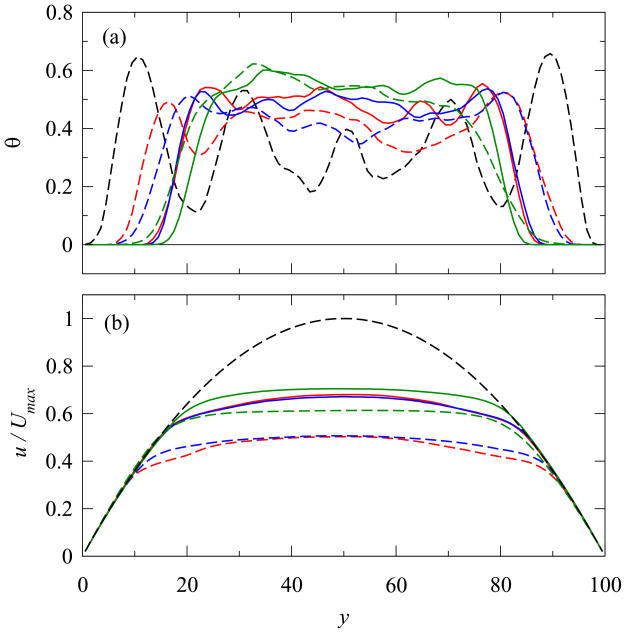
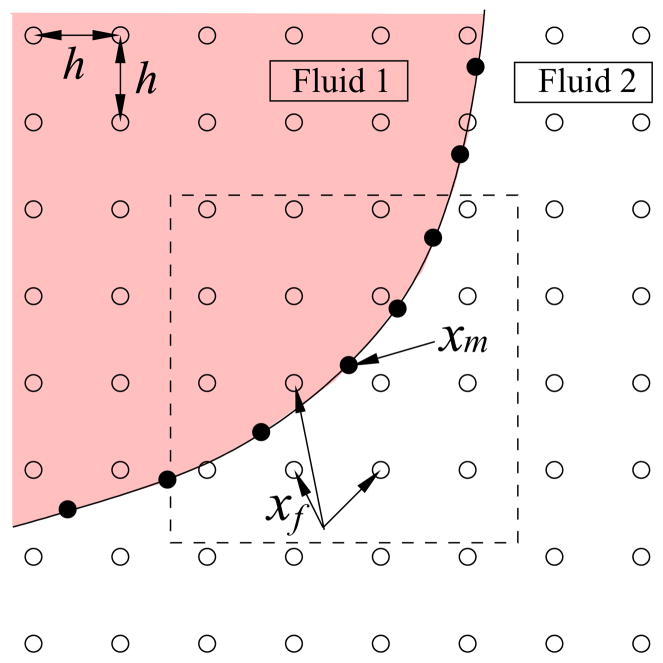
Concentrated erythrocyte (i.e., red blood cell) suspensions flowing in microchannels have been simulated with an immersed-boundary lattice Boltzmann algorithm, to examine the cell layer development process and the effects of cell deformability and aggregation on hemodynamic and hemorheological behaviors. The cells are modeled as two-dimensional deformable biconcave capsules and experimentally measured cell properties have been utilized. The aggregation among cells is modeled by a Morse potential. The flow development process demonstrates how red blood cells migrate away from the boundary toward the channel center, while the suspending plasma fluid is displaced to the cell free layer regions left by the migrating cells. Several important characteristics of microscopic blood flows observed experimentally have been well reproduced in our model, including the cell free layer, blunt velocity profile, changes in apparent viscosity, and the Fahraeus effect. We found that the cell free layer thickness increases with both cell deformability and aggregation strength. Due to the opposing effects of the cell free layer lubrication and the high viscosity of cell-concentrated core, the influence of aggregation is complex but the lubrication effect appears to dominate, causing the relative apparent viscosity to decrease with aggregation. It appears therefore that the immersed-boundary lattice Boltzmann numerical model may be useful in providing valuable information on microscopic blood flows in various microcirculation situations.
Figures
Similar articles
-
Geometrical focusing of cells in a microfluidic device: an approach to separate blood plasma.Biorheology. 2006;43(2):147-59. Biorheology. 2006. PMID: 16687784
-
Microvascular blood flow resistance: Role of red blood cell migration and dispersion.Microvasc Res. 2015 May;99:57-66. doi: 10.1016/j.mvr.2015.02.006. Epub 2015 Feb 25. Microvasc Res. 2015. PMID: 25724979
-
Red blood cell aggregation and dissociation in shear flows simulated by lattice Boltzmann method.J Biomech. 2008;41(1):47-55. doi: 10.1016/j.jbiomech.2007.07.020. Epub 2007 Sep 20. J Biomech. 2008. PMID: 17888442 Free PMC article.
-
Numerical simulations of deformation and aggregation of red blood cells in shear flow.Crit Rev Biomed Eng. 2013;41(4-5):425-34. doi: 10.1615/critrevbiomedeng.2014010689. Crit Rev Biomed Eng. 2013. PMID: 24941417 Review.
-
Disturbed blood flow structuring as critical factor of hemorheological disorders in microcirculation.Clin Hemorheol Microcirc. 1998 Dec;19(4):315-25. Clin Hemorheol Microcirc. 1998. PMID: 9972669 Review.
Cited by
-
Study of blood flow in several benchmark micro-channels using a two-fluid approach.Int J Eng Sci. 2015 Oct 1;95:49-59. doi: 10.1016/j.ijengsci.2015.06.004. Int J Eng Sci. 2015. PMID: 26240438 Free PMC article.
-
Estimation of membrane bending modulus of stiffness tuned human red blood cells from micropore filtration studies.PLoS One. 2019 Dec 31;14(12):e0226640. doi: 10.1371/journal.pone.0226640. eCollection 2019. PLoS One. 2019. PMID: 31891585 Free PMC article.
-
Image-based flow simulation of platelet aggregates under different shear rates.PLoS Comput Biol. 2023 Jul 10;19(7):e1010965. doi: 10.1371/journal.pcbi.1010965. eCollection 2023 Jul. PLoS Comput Biol. 2023. PMID: 37428797 Free PMC article.
-
Modeling particle shape-dependent dynamics in nanomedicine.J Nanosci Nanotechnol. 2011 Feb;11(2):919-28. doi: 10.1166/jnn.2011.3536. J Nanosci Nanotechnol. 2011. PMID: 21399713 Free PMC article.
-
Examining metastatic behavior within 3D bioprinted vasculature for the validation of a 3D computational flow model.Sci Adv. 2020 Aug 26;6(35):eabb3308. doi: 10.1126/sciadv.abb3308. eCollection 2020 Aug. Sci Adv. 2020. PMID: 32923637 Free PMC article.
References
-
- Mchedlishvili G, Maeda N. Blood flow structure related to red cell flow: a determinant of blood fluidity in narrow microvessels. Japanese Journal of Physiology. 2001;51(1):19–30. - PubMed
-
- Stoltz JF, Singh M, Riha P. Hemorheology in Practice. IOS Press; Amsterbam, Netherlands: 1999.
-
- Baumler H, Neu B, Donath E, Kiesewetter H. Basic phenomena of red blood cell rouleaux formation biorheology. Biorheology. 1999;36:439–442. - PubMed
-
- Sharan M, Popel AS. A two-phase model for blood flow in narrow tubes with increased viscosity near the wall. Biorheology. 2001;38:415–428. - PubMed
Publication types
MeSH terms
Grants and funding
LinkOut - more resources
Full Text Sources
