. 2009 Mar 26;61(6):880-94.
doi: 10.1016/j.neuron.2009.02.010.

Presynaptic regulation of astroglial excitatory neurotransmitter transporter GLT1

Affiliations

Presynaptic regulation of astroglial excitatory neurotransmitter transporter GLT1

Yongjie Yang et al. Neuron. .

Abstract

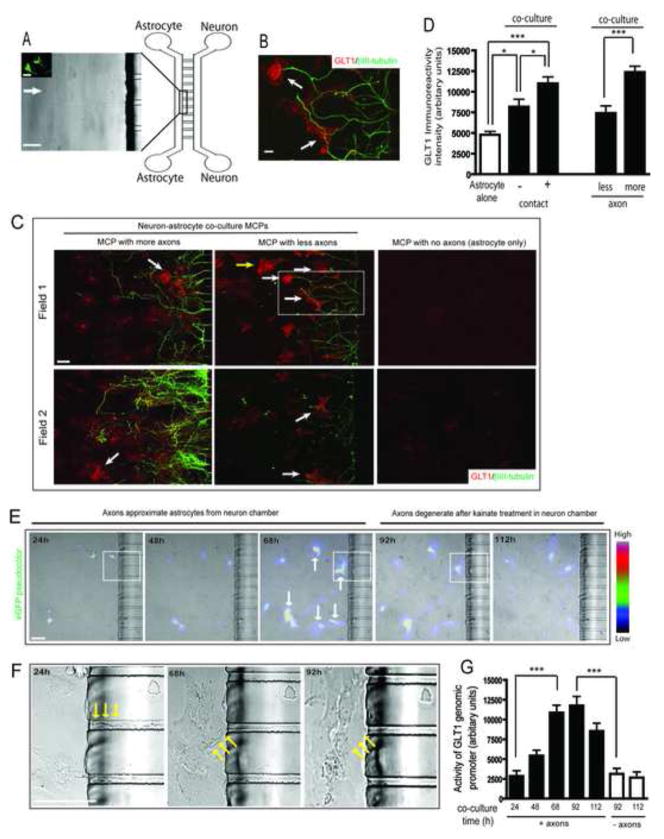
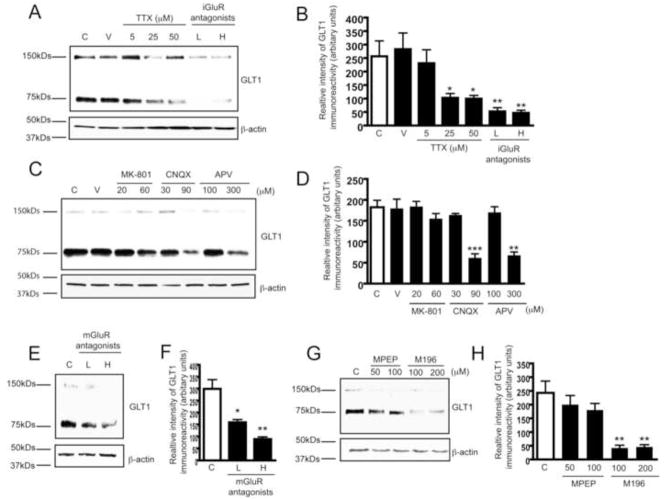
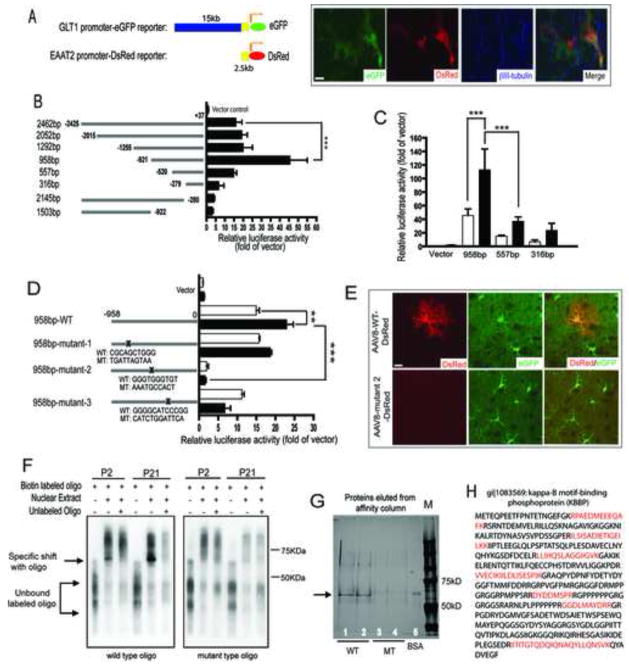
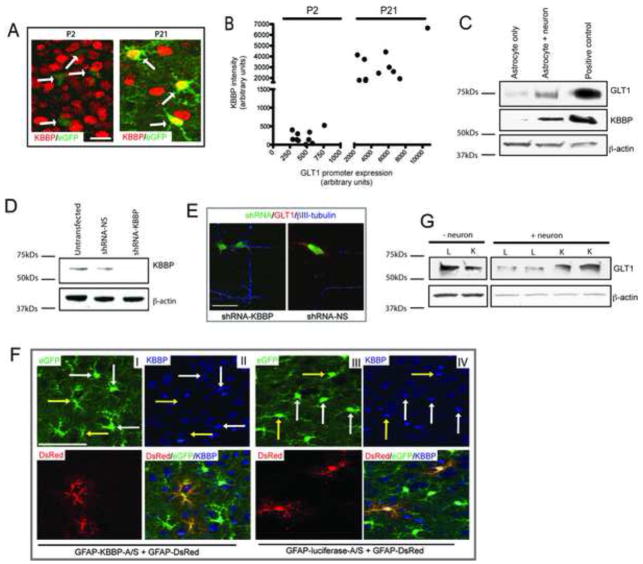
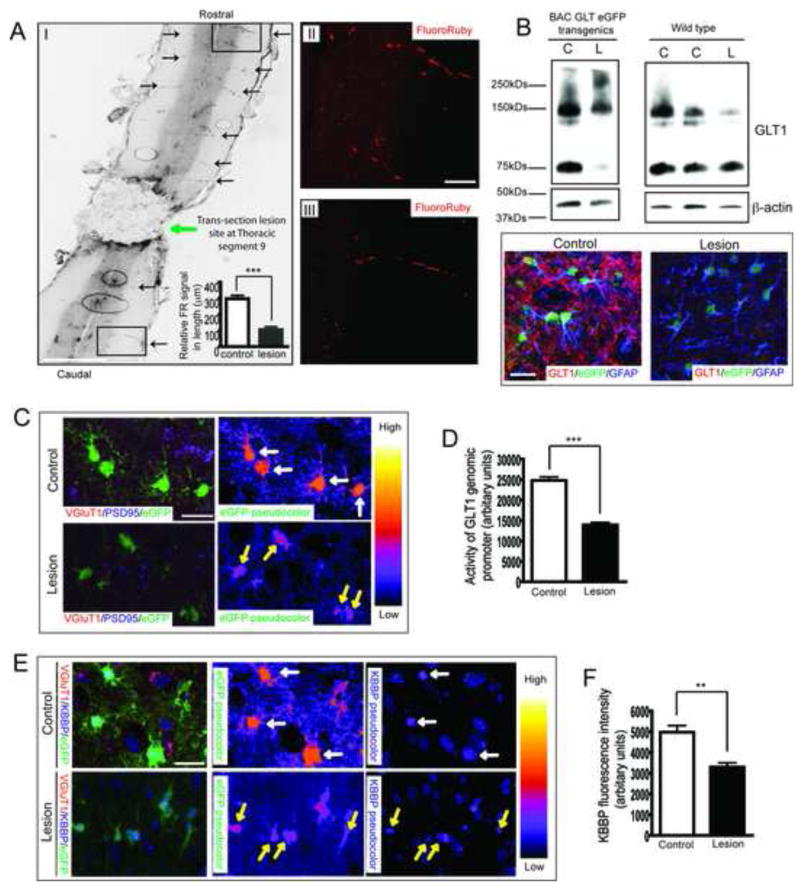
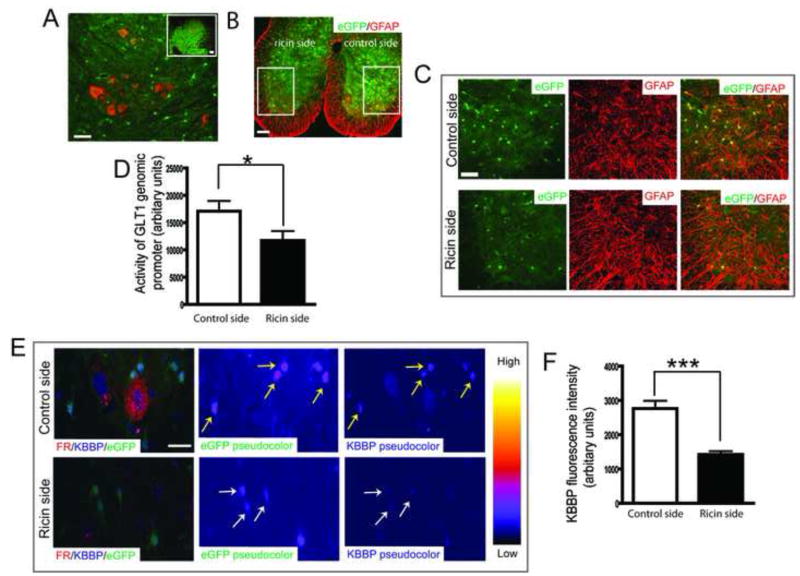
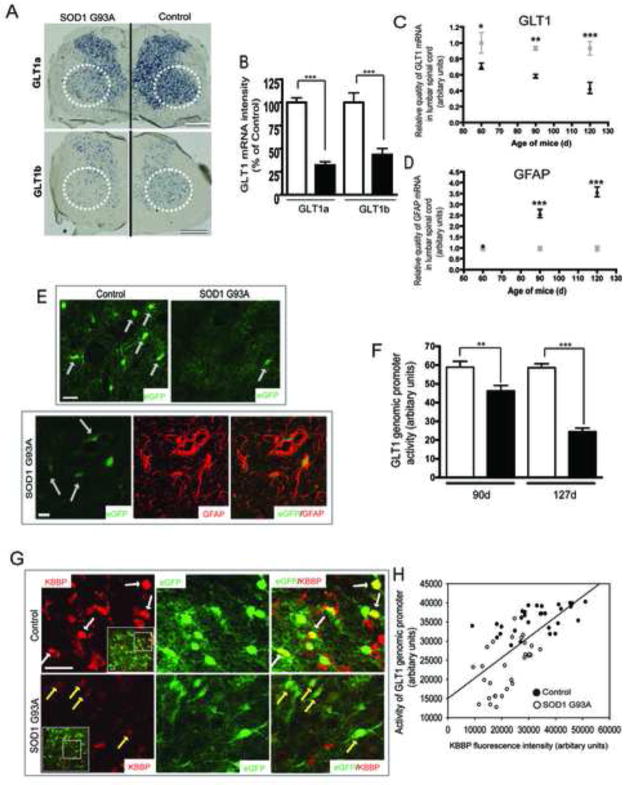
The neuron-astrocyte synaptic complex is a fundamental operational unit of the nervous system. Astroglia regulate synaptic glutamate, via neurotransmitter transport by GLT1/EAAT2. Astroglial mechanisms underlying this essential neuron-glial communication are not known. We now show that presynaptic terminals regulate astroglial synaptic functions, GLT1/EAAT2, via kappa B-motif binding phosphoprotein (KBBP), the mouse homolog of human heterogeneous nuclear ribonucleoprotein K (hnRNP K), which binds the GLT1/EAAT2 promoter. Neuron-stimulated KBBP is required for GLT1/EAAT2 transcriptional activation and is responsible for astroglial alterations in neural injury. Denervation of neuron-astrocyte signaling by corticospinal tract transection, ricin-induced motor neuron death, or neurodegeneration in amyotrophic lateral sclerosis all result in reduced astroglial KBBP expression and transcriptional dysfunction of astroglial transporter expression. Presynaptic elements dynamically coordinate normal astroglial function and also provide a fundamental signaling mechanism by which altered neuronal function and injury leads to dysregulated astroglia in CNS disease.


Figures

Figure 1
Figure 1. Axon-dependent transcriptional activation of GLT1 promoter and GLT1 protein expression on a microfluidic culture platform (MCP)
A. Diagram of an astrocyte neuron co-culture system using a microfluidic culture platform (MCP). Growth cone is stained with 2G13 antibody. Scale bar, 20μm (insert scale bar, 10μm). B. Magnified view of the interaction between axons and astrocytes. Astrocytes were stained with GLT1 and axons were stained with βIII-tubulin antibody. Scale bar, 50μm. C. Axons are sufficient to induce GLT1 up-regulation in cultured astrocytes on MCP. Astrocytes were stained with GLT1 and axons were stained with βIII-tubulin antibody. White arrow: astrocyte with axon contact; yellow arrow; astrocyte without axon contact; Representative two fields were shown from each group. Scale bar, 50 μm. D. Quantitative analysis of axon-induced GLT1 expression (5–10 astrocytes per field, 2–3 field/MCP from total 5–7 MCPs). E. Time-lapse recording of astrocytic eGFP (from BAC GLT1 eGFP mice) fluorescence and outgrowth of axons within MCP. Confocal images were collected 24h to 112h after co-culture. eGFP fluorescence intensity in astrocyte using pseudocolor represention (Image J). Kainate (200 μM) was added to the right side of MCP after taking images at 68h to induce neural injury and axon degeneration. The exchange of solution between chambers is very minimal. Direct treatment of kainite (200 μM) to astrocyte did not change GLT1 expression and astrocyte viability. Scale bar, 50 μm. F. Magnified view of axon and astrocyte interaction in MCP. Examples of axons (yellow arrow) that extend through MCP channels (24h–68h) and axonal degeneration after kainite treatment (68h–92h). Scale bar, 50 μm. G. Quantitative analysis of axon-dependent change of eGFP fluorescence intensity from time-lapse images (5–8 astrocytes per field, 2–3 fields/MCP from total 3–5 MCPs (*P<0.05, *** P<0.001, mean ± SEM, one-way ANOVA and Bonferroni posthoc analysis).
Figure 2
Figure 2. Glutamate receptors are involved in neuron-dependent GLT1 expression
A. Dose-dependent reduction of GLT1 expression levels induced by TTX (5–50μM) and iGluR antagonist cocktail treatment (7d) in rat organotypic spinal cord slice cultures. L: low dose of cocktail (20μM MK801 + 30μM CNQX + 100μM APV); H: high dose of cocktail (60μM MK801 + 90μM CNQX + 300μM APV). B. Densitometric analyses of GLT1 immunoreactivity from immunoblot following seven day TTX or iGluR antagonist cocktail treatment (n=3). C. Effect of individual iGluR antagonists on neuron-dependent GLT1 expression. Rat spinal cord cultures were treated with individual iGluR antagonist for 7d. D. Densitometric analyses of GLT1 immunoreactivity from immunoblot with individual iGluR antagonist (n=3). E. Dose-dependent reduction of GLT1 expression levels induced by mGluR antagonist cocktail treatment (7d) in rat spinal cord slice cultures. L: low dose of cocktail (100μM M196 + 50μM MPEP); H: high dose of cocktail (200μM M196 + 100μM MPEP). F. Densitometric analyses of GLT1 immunoreactivity from immunoblot with mGluR antagonists cocktail treatment (n=3). G. Effect of individual mGluR antagonists on neuron-dependent GLT1 expression. Rat spinal cord slice cultures were treated with individual mGluR antagonists for 7d. H. Densitometric analyses of GLT1 immunoreactivity from immunoblot with individual mGluR antagonists (n=3). All the immunoblots were quantified in Quantity One software and plotted in PRISM (***, P<0.001, **, P<0.01, *, P<0.05, error bars represent SEM, one-way ANOVA and Bonferroni test was used).
Figure 3
Figure 3. Recruitment of Kappa B-motif binding phosphoprotein (KBBP) to GLT1 promoter is required for its activation
A. A 2.5kb of human EAAT2 promoter is sufficient for neuronal stimulation in mouse astrocyte environment. The EAAT2 2.5kb promoter-DsRed reporter and GLT1 genomic promoter-eGFP reporter were both activated in astrocytes following co-culture with neurons identified by βIII-tubulin immunostaining. B. Identification of the regions essential for the basal activity of human EAAT2 promoter by serial deletion of human EAAT2 promoter (n=5–7). C. Promoter sequence from −958bp to −557bp is mainly responsible for neuron-dependent GLT1 promoter activation in primary astrocytes (n=4–8). □=astrocytes alone; ■=astrocytes and neurons. D. Mutagenesis of GGGTGGGTGT from −688bp to −679bp almost completely abolished basal and neuron-dependent GLT1 promoter activity in vitro (n=6–8). For luciferase assay, luciferase promoter reporters were first electroporated into cultured astrocytes and then freshly prepared neurons were plated on the top of transfected astrocytes. β-galactosidase was co-transfected for normalization. E. Mutagenesis of GGGTGGGTGT from −688bp to −679bp abolished GLT1 promoter activation (indicated by DsRed reporter expression) in astrocyte in vivo during early post-natal development. Astrocytes were identified by positive eGFP expression (20–30 astrocytes examined per serial section/mouse for total 4 mice each). F. Mutagenesis of cis-element GGGTGGGTGT abolished its specific binding to nuclear factors during GLT1 promoter activation in early post-natal development. G. Affinity purification by using wild type oligo GGGTGGGTGT but not the mutant oligo found unique nuclear protein from P21 mice cortex nuclear extracts. H. Trypsin digestion and LC/MS/MS identified Kappa B-motif binding phosphoprotein (KBBP) that specifically binds to GGGTGGGTGT. The red-colored amino acid sequences are small peptide sequences identified from LC/MS/MS that also match with KBBP sequence in NCBI.
Figure 4
Figure 4. KBBP is essential and sufficient for neuron-dependent transactivation of GLT1
A. Expression of KBBP protein in astroglia in vivo. KBBP protein expression was minimal in P2 astroglia (BAC GLT1 eGFP reporter, white arrows) and was markedly induced in cortical astrocytes during early post-natal development, along with astroglial BAC-GLT1 eGFP expression (white arrows). Scale bar, 10μm B. Quantitative correlation of KBBP expression levels and GLT1 promoter activity in astroglia during early postnatal development. Positive linear relationship of KBBP expression levels and eGFP intensity was found. The KBBP immunoreactivity and eGFP fluorescence intensity was quantified in Image J (20 astrocytes examined per serial section/mouse for total 4 mice) C. KBBP expression in astrocytes is induced by the presence of neuron. Neurons and astrocytes were co-cultured for one week before sample collected. Positive control: mice brain lysate. D. Development of shRNA that specifically silences KBBP expression. shRNA against KBBP results in over 90% less of KBBP expression in 3T3 NIH cells. E. Silencing of KBBP expression by shRNA reduced GLT1 expression in astrocyte on neuron-astrocyte co-culture MCP. shRNA expressing astrocytes were identified by co-expressed eGFP from shRNA construct. GLT1 expression and neuronal processes were visualized by GLT1 or βIII-tubulin immunostaining, respectively. Scale bar, 20μm. F. AAV mediated expression of KBBP antisense in vivo reduced GLT1 promoter activity during early post-natal development. AAV8-GFAP-KBBP-A/S and AAV8-GFAP-DsRed particles were co-injected into cerebral lateral ventricle of P0 pups of BAC GLT1 eGFP transgenic mice. AAV8-GFAP-luciferase-A/S serves as antisense control for AAV8-GFAP-KBBP-A/S. Antisense expressing astrocytes were identified by DsRed reporter expression (20–30 astrocytes examined per serial section/mouse for total 4 mice each). Scale bar, 50μm (one-way ANOVA with Bonferroni posthoc analysis, **P<0.01, *** P<0.001; mean ± SEM) G. Overexpression of KBBP in astrocytes increases GLT1 expression with the presence of neurons. L: luciferase overexpression; K: KBBP overexpression. Neurons were plated on transfected astrocyte cultures 2d post transfection and kept for one week.
Figure 5
Figure 5. Corticospinal tract presynaptic degeneration induced by spinal cord transection results in loss of GLT1 protein and promoter activity
A. Thoracic transection induces massive degeneration of descending axons. Descending corticospinal tracts were shown by anterograde transport of FR from motor cortex. Abundant FR labelled axons/neurons (black arrow) were observed in white/grey matter of spinal cord above the lesion site (I, Scale bar, 0.5mm). Quantitative analysis of FR-labelled axon length showed that 70% of axons degenerated in lesioned mice compared to sham control mice (n=5). Representative images with FR labeled axons/neurons are shown in II&III, scale bar, 20μm. B. Thoracic spinal cord transection leads to loss of GLT1 protein in lumbar spinal cord by both immunoblotting (n=3) and immunostaining. Scale bar, 20μm. C. Single astrocyte analysis in vivo revealed loss of GLT1 promoter activity in astrocytes surrounding degenerated axons/pre-synaptic terminals of lesioned BAC GLT1 eGFP mice. Pre-synaptic complexes were identified by double staining for pre-synaptic VGluT1 and post-synaptic PSD95. Scale bar, 20μm. D. Quantitative analysis of the eGFP fluorescence intensity in lumbar cord astrocytes of lesioned mice (n≥93). E. Axon degeneration decreases KBBP immunostaining intensity in lumbar cord astrocytes of lesioned BAC GLT1 eGFP mice. Scale bar, 20μm. F. Quantitative analysis of the KBBP immunostaining intensity in lumbar cord astrocytes of lesioned mice (n≥45) (***P<0.001, mean ± SEM).
Figure 6
Figure 6. Motor neuron degeneration induced by neurotoxin ricin leads to reduced GLT1 promoter activity and KBBP expression
A. Visualization of motor neurons in ventral horn of lumbar spinal cord by fluoro-ruby (FR). Femoral nerves were exposed and dipped into FR solution (10%) to allow retrograde transport of FR into motor neurons. Scale bar, 50μm (insert scale bar, 100μm). B. Unilateral administration of ricin induced reduction of eGFP intensity. C. Thin coronal sections of L2-L4 cord of BAC GLT1 eGFP mice was prepared and immunostained with GFAP antibody one week following unilateral administration of ricin. Reduced eGFP intensity but not the GFAP immunoreactivity was found in ricin side. Scale bar, 100μm (50μm for magnified image). D. Fluorescence intensity of eGFP in individual astroglial from ricin and control sides were measured in Image J and plotted using Prism (20–25 astrocytes per serial section/mouse for total 10 mice) (*, P<0.05, mean ± SEM, Student’s t-test). E. Single astrocyte analysis in vivo revealed reduction of KBBP immunoreactivity in astroglia with reduced eGFP intensity. Thin coronal sections of L2-L4 cord of BAC GLT1 eGFP mice was prepared and immunostained with KBBP antibody one week following unilateral administration of ricin. Motor neurons were identified by FR in control side. F. KBBP immunoreactivity in astroglia with reduced eGFP intensity was measured in Image J and plotted in Prism (20–25 astrocytes per serial section/mouse for total 10 mice). Scale bar, 20μm. Yellow arrow: astroglia in control side; White arrow: astroglia in ricin side. (Student’s t-test: ***, P<0.001, mean ± SEM).
Figure 7
Figure 7. GLT1 transcriptional dysfunction contributes to the loss of GLT1 protein in SOD1 G93A rodents
A. In situ hybridization of major GLT1 transcripts in lumbar cord of end-stage (125d) SOD1 G93A rat. Scale bar, 0.5mm. B. Quantitative analysis of in situ signals of GLT1a and GLT1b (20–30 areas examined per serial section per rat, n=3 rats). C. QRT-PCR analysis of GLT1 mRNA levels in lumbar cord of SOD1 G93A mice. D. QRT-PCR analysis of GFAP mRNA levels in lumbar cord of SOD1 G93A mice. Total RNA from lumbar spinal cord of SOD1 G93A mice at different stages (60d, 90d, 120d) was prepared. The GLT1 and GFAP mRNA levels were determined by QRT-PCR with GLT1 or GFAP specific probe. The amount of RNA used in QRT-PCR was normalized by β-actin mRNA and 18s RNA. The GLT1 or GFAP mRNA levels of WT mice at 60d was used as calibrator for mRNA comparison (n=7–12) (2-way ANOVA with posthoc Bonferroni: *P<0.05, **P<0.01, ***P<0.001, mean±SEM). E. Loss of GLT1 promoter activity indicated by eGFP intensity in astrocytes of ventral lumbar cord of BAC GLT1 eGFP X SOD1 G93A mice. No apparent loss of astroglia was observed by GFAP immunostaining. F. Quantitative analysis of eGFP fluorescence intensity in astrocytes of BAC GLT1 eGFP X SOD1 G93A at different ages (35 astrocytes per serial section/mouse for total 20 mice). G. Decreased expression levels of KBBP in astrocytes with reduced eGFP fluorescence intensity in ventral lumbar cord of BAC GLT1 eGFP X SOD1 G93A mice. Scale bar, 20μm (insert scale bar, 50μm). H. Linear regression curve between KBBP immunoreactivity and eGFP intensity in astroglia. KBBP immunoreactivity and eGFP fluorescence intensity was measured in Image J and plotted in SigmaPlot. (n≥25) (Student’s t-test: ***, P<0.001, mean ± SEM).

Comment in

  • What the neuron tells glia.
    Edwards R. Edwards R. Neuron. 2009 Mar 26;61(6):811-2. doi: 10.1016/j.neuron.2009.03.008. Neuron. 2009. PMID: 19323989

Similar articles

Cited by

References

    1. Arnth-Jensen N, Jabaudon D, Scanziani M. Cooperation between independent hippocampal synapses is controlled by glutamate uptake. Nat Neurosci. 2002;5:325–331. - PubMed
    1. Berger UV, DeSilva TM, Chen W, Rosenberg PA. Cellular and subcellular mRNA localization of glutamate transporter isoforms GLT1a and GLT1b in rat brain by in situ hybridization. J Comp Neurol. 2005;492:78–89. - PMC - PubMed
    1. Blinzinger K, Kreutzberg G. Displacement of synaptic terminals from regenerating motoneurons by microglial cells. Z Zellforsch Mikrosk Anat. 1968;85:145–157. - PubMed
    1. Bomsztyk K, Denisenko O, Ostrowski J. hnRNP K: one protein multiple processes. Bioessays. 2004;26:629–638. - PubMed
    1. Bristol LA, Rothstein JD. Glutamate transporter gene expression in amyotrophic lateral sclerosis motor cortex. Ann Neurol. 1996;39:676–679. - PubMed

Publication types

MeSH terms

LinkOut - more resources