Comparative Study
. 2009 May 15;172(2):117-20.
doi: 10.1016/j.pscychresns.2008.11.006. Epub 2009 Mar 25.

Reduction in cerebral blood flow in areas appearing as white matter hyperintensities on magnetic resonance imaging

Affiliations
Comparative Study

Reduction in cerebral blood flow in areas appearing as white matter hyperintensities on magnetic resonance imaging

Adam M Brickman et al. Psychiatry Res. .

Abstract

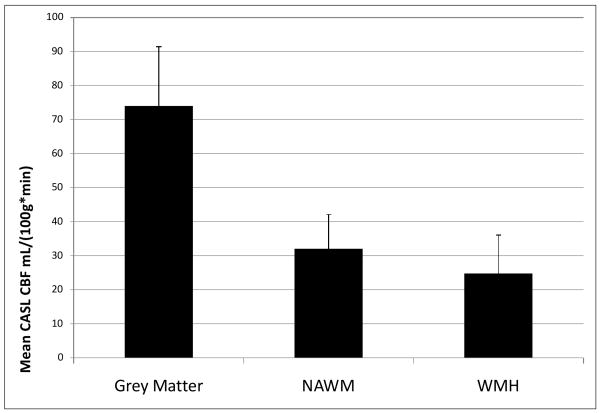
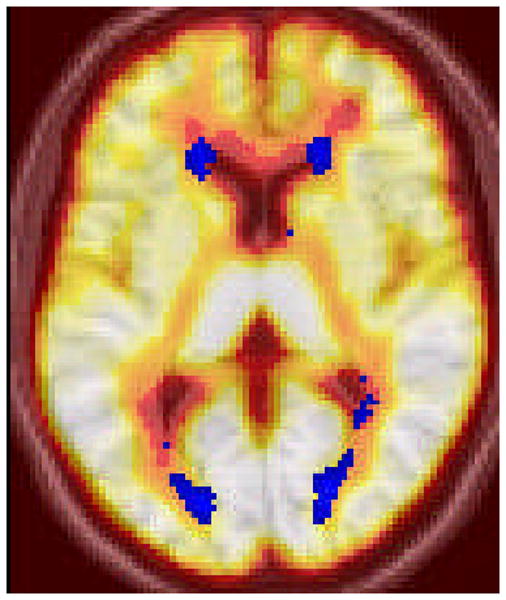
The purpose of this study was to examine cerebral blood flow (CBF) as measured by arterial spin labeling (ASL) in tissue classified as white matter hyperintensities (WMH), normal appearing white matter, and grey matter. Seventeen healthy older adults received structural and ASL MRI. Cerebral blood flow was derived for three tissue types: WMH, normal appearing white matter, and grey matter. Cerebral blood flow was lower in WMH areas relative to normal appearing white matter, which in turn, was lower than grey matter. Regions with consistently lower CBF across individuals were more likely to appear as WMH. Results are consistent with an emerging literature linking diminished regional perfusion with the risk of developing WMH.


Figures

Figure 1
Figure 1
Mean differences in CASL-determined blood flow in grey matter regions, normal appearing white matter (NAWM), and in areas with white matter hyperintensities (WMH). Error bars are standard deviations. All pairwise comparisons are statistically significant (p<0.001).
Figure 2
Figure 2
Voxels labeled as WMH in at least 5 subjects (in blue) superimposed on the mean CBF image derived by the average of all subjects' CASL images.
Figure 3
Figure 3
Mean group CBF displayed as a function of the frequency (i.e., number of subjects) in which voxels are labeled as WMH. Each circle represents a single voxel. For example, a single circle in Frequency = 5 represents the total group mean CBF for a voxel that is labeled as WMH in five subjects. Note subtle decline in group mean CBF across frequency (red dot) in marked decrease in variability, suggesting that areas with consistently lower CBF are most likely to be WMH across individuals. The number of voxels included for each frequency, 1 through 15, respectively, are 12109, 3811, 1796, 1125, 795, 608, 482, 377, 269, 212, 114, 58, 32, 10, and 4.

References

    1. Alsop DC, Detre JA. Reduced transit-time sensitivity in noninvasive magnetic resonance imaging of human cerebral blood flow. J Cereb Blood Flow Metab. 1996;16:1236–1249. - PubMed
    1. Andrews-Hanna JR, Snyder AZ, Vincent JL, Lustig C, Head D, Raichle ME, Buckner RL. Disruption of large-scale brain systems in advanced aging. Neuron. 2007;56:924–935. - PMC - PubMed
    1. Asllani I, Habeck C, Scarmeas N, Borogovac A, Brown TR, Stern Y. Multivariate and univariate analysis of continuous arterial spin labeling perfusion MRI in Alzheimer's disease. J Cereb Blood Flow Metab 2007 - PMC - PubMed
    1. Brickman AM, Honig LS, Scarmeas N, Tatarina O, Sanders L, Albert MS, Brandt J, Blacker D, Stern Y. Measuring cerebral atrophy and white matter hyperintensity burden to predict the rate of cognitive decline in Alzheimer disease. Arch Neurol. 2008a;65:1202–1208. - PMC - PubMed
    1. Brickman AM, Schupf N, Manly JJ, Luchsinger JA, Andrews H, Tang MX, Reitz C, Small SA, Mayeux R, DeCarli C, Brown TR. Brain morphology in older African Americans, Caribbean Hispanics, and whites from northern Manhattan. Arch Neurol. 2008b;65:1053–1061. - PMC - PubMed

Publication types