

Modelling mitochondrial site polymorphisms to infer the number of segregating units and mutation rate
- PMID: 19324622
- PMCID: PMC2679937
- DOI: 10.1098/rsbl.2009.0104
Modelling mitochondrial site polymorphisms to infer the number of segregating units and mutation rate
Abstract
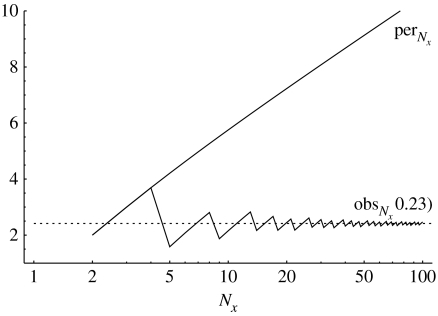
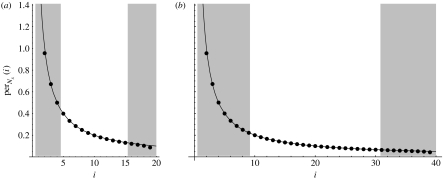
We present a mathematical model of mitochondrial inheritance evolving under neutral evolution to interpret the heteroplasmies observed at some sites. A comparison of the levels of heteroplasmies transmitted from mother to her offspring allows us to estimate the number N(x) of inherited mitochondrial genomes (segregating units). The model demonstrates the necessity of accounting for both the multiplicity of an unknown number N(x), and the threshold , below which heteroplasmy cannot be detected reliably, in order to estimate the mitochondrial mutation rate mu(m) in the maternal line of descent. Our model is applicable to pedigree studies of any eukaryotic species where site heteroplasmies are observed in regions of the mitochondria, provided neutrality can be assumed. The model is illustrated with an analysis of site heteroplasmies in the first hypervariable region of mitochondrial sequence data sampled from Adélie penguin families, providing an estimate N(x) and mu(m). This estimate of mu(m) was found to be consistent with earlier estimates from ancient DNA analysis.
Figures
Similar articles
-
Mutation and evolutionary rates in adélie penguins from the antarctic.PLoS Genet. 2008 Oct 3;4(10):e1000209. doi: 10.1371/journal.pgen.1000209. PLoS Genet. 2008. PMID: 18833304 Free PMC article.
-
Presence and transmission of mitochondrial heteroplasmic mutations in human populations of European and African ancestry.Mitochondrion. 2021 Sep;60:33-42. doi: 10.1016/j.mito.2021.07.004. Epub 2021 Jul 21. Mitochondrion. 2021. PMID: 34303007 Free PMC article.
-
Transmission of human mtDNA heteroplasmy in the Genome of the Netherlands families: support for a variable-size bottleneck.Genome Res. 2016 Apr;26(4):417-26. doi: 10.1101/gr.203216.115. Epub 2016 Feb 25. Genome Res. 2016. PMID: 26916109 Free PMC article.
-
Fungal mitochondrial genomes and genetic polymorphisms.Appl Microbiol Biotechnol. 2018 Nov;102(22):9433-9448. doi: 10.1007/s00253-018-9350-5. Epub 2018 Sep 12. Appl Microbiol Biotechnol. 2018. PMID: 30209549 Review.
-
The rate of adaptive evolution in animal mitochondria.Mol Ecol. 2016 Jan;25(1):67-78. doi: 10.1111/mec.13475. Epub 2015 Dec 17. Mol Ecol. 2016. PMID: 26578312 Free PMC article. Review.
Cited by
-
Mitochondrial DNA mutations in human oocytes undergo frequency-dependent selection but do not increase with age.bioRxiv [Preprint]. 2024 Dec 12:2024.12.09.627454. doi: 10.1101/2024.12.09.627454. bioRxiv. 2024. PMID: 39713397 Free PMC article. Preprint.
-
Allele frequency selection and no age-related increase in human oocyte mitochondrial mutations.Sci Adv. 2025 Aug 8;11(32):eadw4954. doi: 10.1126/sciadv.adw4954. Epub 2025 Aug 6. Sci Adv. 2025. PMID: 40768572 Free PMC article.
-
Age-related accumulation of de novo mitochondrial mutations in mammalian oocytes and somatic tissues.PLoS Biol. 2020 Jul 15;18(7):e3000745. doi: 10.1371/journal.pbio.3000745. eCollection 2020 Jul. PLoS Biol. 2020. PMID: 32667908 Free PMC article.
-
Advanced age increases frequencies of de novo mitochondrial mutations in macaque oocytes and somatic tissues.Proc Natl Acad Sci U S A. 2022 Apr 12;119(15):e2118740119. doi: 10.1073/pnas.2118740119. Epub 2022 Apr 8. Proc Natl Acad Sci U S A. 2022. PMID: 35394879 Free PMC article.
-
A Population Phylogenetic View of Mitochondrial Heteroplasmy.Genetics. 2018 Mar;208(3):1261-1274. doi: 10.1534/genetics.118.300711. Epub 2018 Jan 17. Genetics. 2018. PMID: 29343499 Free PMC article.
References
-
- Birky C.W. Evolution and population genetics of organelle genes. In: Selander R.K., Clark A.G., Whittam T.S., editors. Evolution at the molecular level. Sinauer; Sunderland, MA: 1991. pp. 112–134. (See also pp. 202–221.)
-
- Brandstätter A., Niederstätter H., Parson W. Monitoring the inheritance of heteroplasmy by computer-assisted detection of mixed base-calls in the entire human mitochondrial control region. Int. J. Legal Med. 2004;118:47–54. doi:10.1007/s00414-003-0418-z - DOI - PubMed
-
- Ewens W.J. Springer; New York, NY: 2004. Mathematical population genetics.
-
- Howell N., Smejkal C.B., Mackey D.A., Chinnery P.F., Turnbull D.M., Herrnstadt C. The pedigree rate of sequence divergence in the human mitochondrial genome: there is a difference between phylogenetic and pedigree rates. Am. J. Hum. Genet. 2003;72:659–670. doi:10.1086/368264 - DOI - PMC - PubMed
-
- Lambert D.M., Ritchie P.A., Millar C.D., Holland B., Drummond A.J., Baroni C. Rates of evolution in ancient DNA from Adélie penguins. Science. 2002;295:2270–2273. doi:10.1126/science.1068105 - DOI - PubMed
Publication types
MeSH terms
Substances
LinkOut - more resources
Full Text Sources
Research Materials
