. 2009 Jun 7;276(1664):2071-80.
doi: 10.1098/rspb.2009.0057. Epub 2009 Mar 4.

Implications of vaccination and waning immunity

Affiliations

Implications of vaccination and waning immunity

J M Heffernan et al. Proc Biol Sci. .

Abstract

For infectious diseases where immunization can offer lifelong protection, a variety of simple models can be used to explain the utility of vaccination as a control method. However, for many diseases, immunity wanes over time and is subsequently enhanced (boosted) by asymptomatic encounters with the infection. The study of this type of epidemiological process requires a model formulation that can capture both the within-host dynamics of the pathogen and immune system as well as the associated population-level transmission dynamics. Here, we parametrize such a model for measles and show how vaccination can have a range of unexpected consequences as it reduces the natural boosting of immunity as well as reducing the number of naive susceptibles. In particular, we show that moderate waning times (40-80 years) and high levels of vaccination (greater than 70%) can induce large-scale oscillations with substantial numbers of symptomatic cases being generated at the peak. In addition, we predict that, after a long disease-free period, the introduction of infection will lead to far larger epidemics than that predicted by standard models. These results have clear implications for the long-term success of any vaccination campaign and highlight the need for a sound understanding of the immunological mechanisms of immunity and vaccination.


Figures
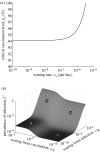
Figure 1
Figure 1
Behaviour of the simple SIR model with waning immunity (equation (2.1)). (a) The critical vaccination level is shown as the waning rate of immunity, ωv, increases. (b) The equilibrium behaviour of I* with respect to the two waning rates ωR and ωV. The values of all other model parameters are: g=1/7 day−1; d=1/(74×365) day−1; and β=17(g+d) day−1 such that R0=17: in general, these are comparable to measles parameters and human demography in developed countries. In (b), a vaccination level of p=0.6 was assumed.
Figure 2
Figure 2
The in-host model. (a,b) The infected cells (y) and memory cells (m) following infection for 14 different levels of memory: m(0)=0, 3, 6, 9, 12, 20, 30, 40, 50, 60, 70, 80, 90, 100 μl−1 of plasma. (c,d) The calculated value of R0 (see the electronic supplementary material) and the boosted level of memory cells (m(end)) for a range of different initial memory levels, m(0). Parameter values for the in-host model are listed in table 1 of the electronic supplementary material. Parametrization of the in-host model is discussed in Heffernan & Keeling (2008) and in the electronic supplementary material.
Figure 3
Figure 3
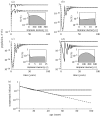
A comparison of the standard SEIR model (dashed lines) and the aggregate population dynamics of equation (3.2), which most closely corresponds to the four standard classes (grey lines): S0, E0, I0 and i>0(Si+Ri) correspond to the S, E, I and R compartments from the standard SEIR model, respectively. The solid black lines in (a) susceptible and (d) recovered graphs show iSiandiRi, respectively ((b) exposed and (c) infectious). The insets show the long-term distributions of the immune memory (i) at the infected equilibrium. Here, we have assumed immunity wanes over 80 years (dm≈1/16 years−1). (e) The predicted number of symptomatic infected individuals (iIi,i<6 μl−1 of plasma) against age for three wane times, ∞ (dashed line, corresponding to the standard SEIR model, dm=0 years−1), 30 years (dotted line, dm≈6 years−1) and 80 years (grey line, dm≈16 years−1).
Figure 4
Figure 4
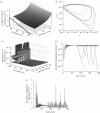
Behaviour of equations (3.2) and (5.1) showing the impact of vaccination and waning immunity. Vaccination refers to the percentage of newborns that are vaccinated, whereas the period of waning immunity (τ) is related to the death rate of memory cells using the equation 1/dm=τ/log(ml/mu) years, where mu is the level of immunity acquired after natural infection in a naive host; and ml is the lower bound of immunity. (a) The average prevalence of infection showing how waning immunity can severely limit the effects of vaccination. The wane time of ∞ refers to the standard SEIR assumptions when recovered individuals never re-enter the susceptible class. (b) Examples of the dynamics from equations (3.2) and (5.1); 92% of newborns are vaccinated and immunity gained from natural infection in a totally naive host wanes over 30 (dotted line), 40 (solid line), 50 (dash dotted line) and 60 (dashed line) years. (c) The maximum proportion of infectious cases around the epidemic cycle (upper surface) compared with the average (lower surface), illustrating the large relative amplitude of the infectious cycles that can be induced from high levels of vaccination and slow waning immunity. (de) The prevalence of symptomatic cases predicted by equations (3.2) and (5.1) when vaccinating close to the critical threshold (p=0.94) for three levels of waning immunity (dashed line, no waning immunity (SEIR); dotted line, 30-year waning immunity; grey line, 80-year waning immunity); the vaccination programme begins on year 80. Prevalence is displayed on both a log and linear scale to better illustrate the dynamics.

References

    1. Alizon S., Van Baalen M. Emergence of a convex trade-off between transmission and virulence. Am. Nat. 2005;165:E155–E167. doi:10.1086/430053 - DOI - PubMed
    1. Anderson R.M., May R.M. Oxford University Press; Oxford, UK: 1992. Infectious diseases of humans.
    1. Andre´ J.B., Ferdy J.B., Godelle B. Within-host parasite dynamics, emerging trade-off, and evolution of virulence with immune system. Evolution. 2003;57:1489–1497. doi:10.1554/02-667 - DOI - PubMed
    1. Antia R., Levin B.R., May R.M. Within-host population dynamics and the evolution and maintenance of microparasite virulence. Am. Nat. 1994;144:457–472. doi:10.1086/285686 - DOI
    1. Baccam P., Beauchemin C., Macken C.A., Hayden F.G., Perelson A.S. Kinetics of influenza A virus infection in humans. J. Virol. 2006;80:7590–7599. doi:10.1128/JVI.01623-05 - DOI - PMC - PubMed

Publication types