

Reversal of evolutionary downsizing caused by selective harvest of large fish
- PMID: 19324761
- PMCID: PMC2677248
- DOI: 10.1098/rspb.2009.0003
Reversal of evolutionary downsizing caused by selective harvest of large fish
Abstract
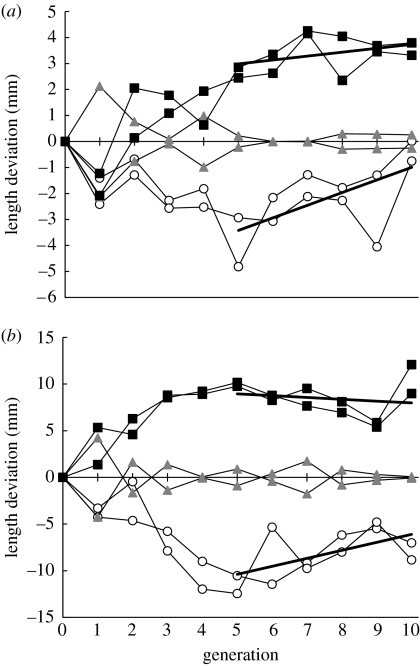
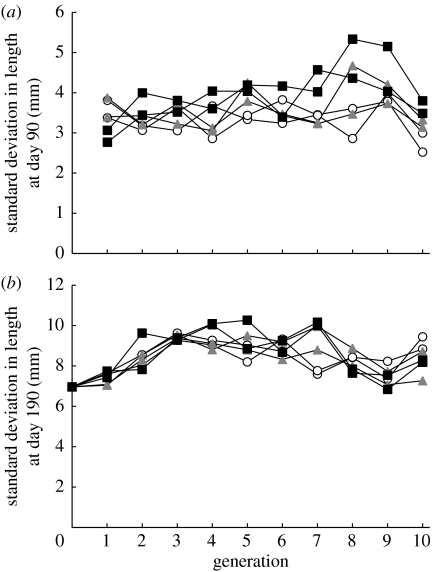
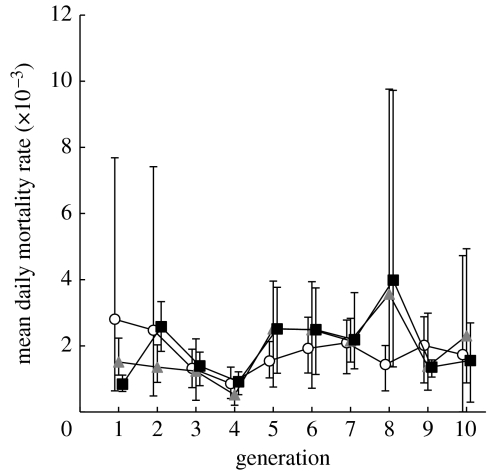
Evolutionary responses to the long-term exploitation of individuals from a population may include reduced growth rate, age at maturation, body size and productivity. Theoretical models suggest that these genetic changes may be slow or impossible to reverse but rigorous empirical evidence is lacking. Here, we provide the first empirical demonstration of a genetically based reversal of fishing-induced evolution. We subjected six populations of silverside fish (Menidia menidia) to three forms of size-selective fishing for five generations, thereby generating twofold differences among populations in mean weight and yield (biomass) at harvest. This was followed by an additional five generations during which size-selective harvest was halted. We found that evolutionary changes were reversible. Populations evolving smaller body size when subjected to size-selective fishing displayed a slow but significant increase in size when fishing ceased. Neither phenotypic variance in size nor juvenile survival was reduced by the initial period of selective fishing, suggesting that sufficient genetic variation remained to allow recovery. By linear extrapolation, we predict full recovery in about 12 generations, although the rate of recovery may taper off near convergence. The recovery rate in any given wild population will also depend on other agents of selection determined by the specifics of life history and environment. By contrast, populations that in the first five generations evolved larger size and yield showed little evidence of reversal. These results show that populations have an intrinsic capacity to recover genetically from harmful evolutionary changes caused by fishing, even without extrinsic factors that reverse the selection gradient. However, harvested species typically have generation times of 3-7 years, so recovery may take decades. Hence, the need to account for evolution in managing fisheries remains.
Figures
References
-
- Allendorf F.W., England P.R., Luikart G., Ritchie P.A., Ryman N. Genetic effects of harvest on wild animal populations. Trends Ecol. Evol. 2008;23:327–337. doi:10.1016/j.tree.2008.02.008 - DOI - PubMed
-
- Biro P.A., Post J.R. Rapid depletion of genotypes with fast growth and bold personality traits from harvested fish populations. Proc. Natl Acad. Sci. USA. 2008;105:2919–2922. doi:10.1073/pnas.0708159105 - DOI - PMC - PubMed
-
- Carlson S.M., Edeline E., Vøllestad L.A., Haugen T., Winfield I.J., Fletcher J.M., Ben J.J., Stenseth N.C. Four decades of opposing natural and human-induced artificial selection acting on Windermere pike (Esox lucius) Ecol. Lett. 2007;10:512–521. doi:10.1111/j.1461-0248.2007.01046.x - DOI - PubMed
-
- Chiba S., Arnott S.A., Conover D.O. Coevolution of foraging behavior with intrinsic growth rate: risk-taking in naturally and artificially selected growth genotypes of Menidia menidia. Oecologia. 2007;154:237–246. doi:10.1007/s00442-007-0825-9 - DOI - PubMed
-
- Coltman D.W., O'Donoghue P., Jorgenson J.T., Hogg J.T., Strobeck C., Festa-Bianchet M. Undesirable evolutionary consequences of trophy hunting. Nature. 2003;426:655–658. doi:10.1038/nature02177 - DOI - PubMed
Publication types
MeSH terms
LinkOut - more resources
Full Text Sources
