

Dynamics of range margins for metapopulations under climate change
- PMID: 19324811
- PMCID: PMC2677226
- DOI: 10.1098/rspb.2008.1681
Dynamics of range margins for metapopulations under climate change
Abstract
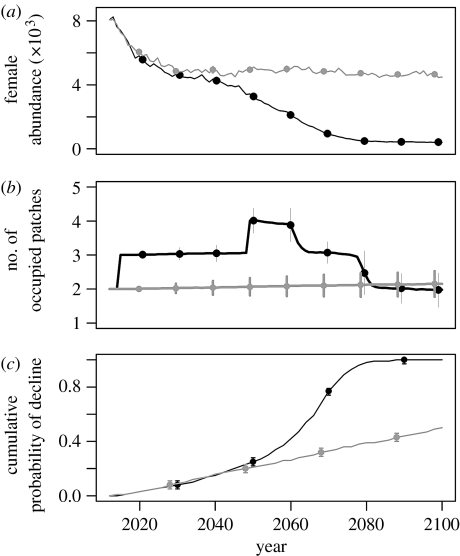
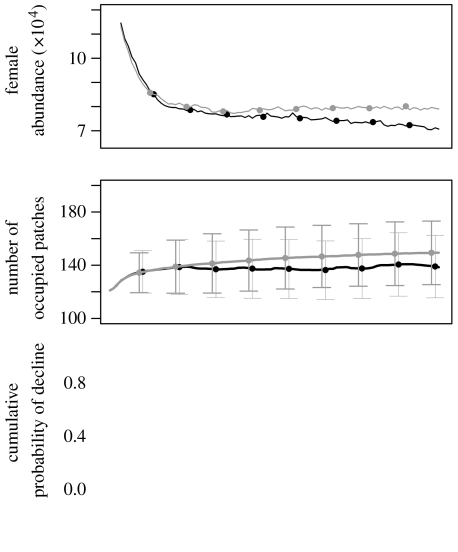
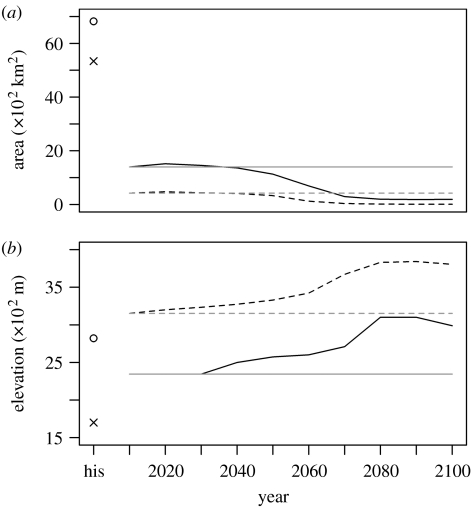
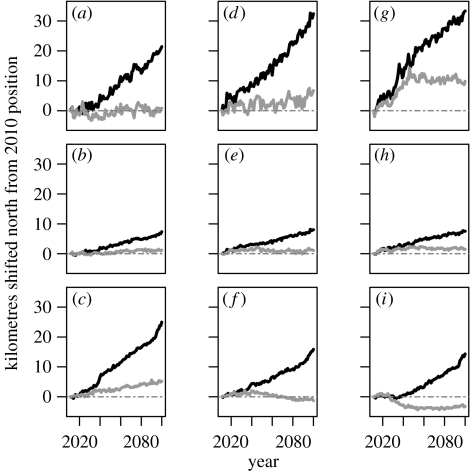
We link spatially explicit climate change predictions to a dynamic metapopulation model. Predictions of species' responses to climate change, incorporating metapopulation dynamics and elements of dispersal, allow us to explore the range margin dynamics for two lagomorphs of conservation concern. Although the lagomorphs have very different distribution patterns, shifts at the edge of the range were more pronounced than shifts in the overall metapopulation. For Romerolagus diazi (volcano rabbit), the lower elevation range limit shifted upslope by approximately 700 m. This reduced the area occupied by the metapopulation, as the mountain peak currently lacks suitable vegetation. For Lepus timidus (European mountain hare), we modelled the British metapopulation. Increasing the dispersive estimate caused the metapopulation to shift faster on the northern range margin (leading edge). By contrast, it caused the metapopulation to respond to climate change slower, rather than faster, on the southern range margin (trailing edge). The differential responses of the leading and trailing range margins and the relative sensitivity of range limits to climate change compared with that of the metapopulation centroid have important implications for where conservation monitoring should be targeted. Our study demonstrates the importance and possibility of moving from simple bioclimatic envelope models to second-generation models that incorporate both dynamic climate change and metapopulation dynamics.
Figures
References
-
- Akçakaya H.R., Root W.T. Applied Biomathematics; Setauket, NY: 2005. RAMAS GIS: linking landscape data with population viability analysis (v. 5.0)
-
- Akçakaya H.R., Butchart S.H.M., Mace G.M., Stuart S.N., Hilton-Taylor C. Use and misuse of the IUCN red list criteria in projecting climate change impacts on biodiversity. Glob. Chang. Biol. 2006;12:2037–2043. doi:10.1111/j.1365-2486.2006.01253.x - DOI
-
- Araújo M.B., Luoto M. The importance of biotic interactions for modelling species distributions under climate change. Glob. Ecol. Biogeogr. 2007;16:743–753. doi:10.1111/j.1466-8238.2007.00359.x - DOI
-
- Brook B.W., Sodhi N.S., Bradshaw C.J.A. Synergies among extinction drivers under global change. Trends Ecol. Evol. 2008;23:453–460. doi:10.1016/j.tree.2008.03.011 - DOI - PubMed
-
- Carroll C. Interacting effects of climate change, landscape conversion, and harvest on carnivore populations at the range margin: marten and lynx in the northern Appalachians. Conserv. Biol. 2007;21:1092–1104. doi:10.1111/j.1523-1739.2007.00719.x - DOI - PubMed
Publication types
MeSH terms
LinkOut - more resources
Full Text Sources
Molecular Biology Databases
Miscellaneous
