Physiological tolerances account for range limits and abundance structure in an invasive slug
- PMID: 19324817
- PMCID: PMC2677229
- DOI: 10.1098/rspb.2008.1240
Physiological tolerances account for range limits and abundance structure in an invasive slug
Abstract
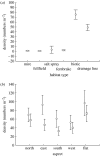
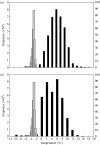
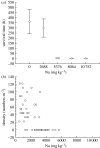
Despite the importance of understanding the mechanisms underlying range limits and abundance structure, few studies have sought to do so. Here we use a terrestrial slug species, Deroceras panormitanum, that has invaded a remote, largely predator-free, Southern Ocean island as a model system to do so. Across Marion Island, slug density does not conform to an abundant centre distribution. Rather, abundance structure is characterized by patches and gaps. These are associated with this desiccation-sensitive species' preference for biotic and drainage line habitats that share few characteristics except for their high humidity below the vegetation surface. The coastal range margin has a threshold form, rapidly rising from zero to high density. Slugs do not occur where soil-exchangeable Na values are higher than 3000 mg kg(-1), and in laboratory experiments, survival is high below this value but negligible above it. Upper elevation range margins are a function of the inability of this species to survive temperatures below an absolute limit of -6.4 degrees C, which is regularly exceeded at 200 m altitude, above which slug density declines to zero. However, the linear decline in density from the coastal peak is probably also a function of a decline in performance or time available for activity. This is probably associated with an altitudinal decline in mean annual soil temperature. These findings support previous predictions made regarding the form of density change when substrate or climatic factors set range limits.
Figures


References
-
- Alleaume-Benharira M., Pen I.R., Ronce O. Geographical patterns of adaptation within a species' range: interactions between drift and gene flow. J. Evol. Biol. 2006;19:203–215. doi:10.1111/j.1420-9101.2005.00976.x - DOI - PubMed
-
- Ansart A., Vernon P. Cold hardiness in molluscs. Acta Oecol. 2003;24:95–102. doi:10.1016/S1146-609X(03)00045-6 - DOI
-
- Austin M. Species distribution models and ecological theory: a critical assessment and some possible new approaches. Ecol. Model. 2007;200:1–19. doi:10.1016/j.ecolmodel.2006.07.005 - DOI
-
- Battisti A., Stastny M., Buffo E., Larsson S. A rapid altitudinal range expansion in the pine processionary moth produced by the 2003 climatic anomaly. Glob. Change Biol. 2006;12:662–671. doi:10.1111/j.1365-2486.2006.01124.x - DOI
-
- Bird J.M., Hodkinson I.D. What limits the altitudinal distribution of Craspedolepta species (Sternorrhyncha: Psylloidea) on fireweed? Ecol. Entomol. 2005;30:510–520. doi:10.1111/j.0307-6946.2005.00719.x - DOI
MeSH terms
LinkOut - more resources
Full Text Sources
Research Materials

