. 2009 Jun 15;18(12):2188-203.
doi: 10.1093/hmg/ddp151. Epub 2009 Mar 26.

Complex rearrangements in patients with duplications of MECP2 can occur by fork stalling and template switching

Affiliations

Complex rearrangements in patients with duplications of MECP2 can occur by fork stalling and template switching

Claudia M B Carvalho et al. Hum Mol Genet. .

Abstract

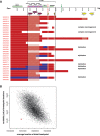
Duplication at the Xq28 band including the MECP2 gene is one of the most common genomic rearrangements identified in neurodevelopmentally delayed males. Such duplications are non-recurrent and can be generated by a non-homologous end joining (NHEJ) mechanism. We investigated the potential mechanisms for MECP2 duplication and examined whether genomic architectural features may play a role in their origin using a custom designed 4-Mb tiling-path oligonucleotide array CGH assay. Each of the 30 patients analyzed showed a unique duplication varying in size from approximately 250 kb to approximately 2.6 Mb. Interestingly, in 77% of these non-recurrent duplications, the distal breakpoints grouped within a 215 kb genomic interval, located 47 kb telomeric to the MECP2 gene. The genomic architecture of this region contains both direct and inverted low-copy repeat (LCR) sequences; this same region undergoes polymorphic structural variation in the general population. Array CGH revealed complex rearrangements in eight patients; in six patients the duplication contained an embedded triplicated segment, and in the other two, stretches of non-duplicated sequences occurred within the duplicated region. Breakpoint junction sequencing was achieved in four duplications and identified an inversion in one patient, demonstrating further complexity. We propose that the presence of LCRs in the vicinity of the MECP2 gene may generate an unstable DNA structure that can induce DNA strand lesions, such as a collapsed fork, and facilitate a Fork Stalling and Template Switching event producing the complex rearrangements involving MECP2.


Figures
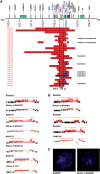
Figure 1.
Figure 1.
(A) Genomic region harboring duplications in our cohort of 30 patients analyzed by oligonucleotide array CGH. Solid red bars represent oligonucleotide probes for which the mean normalized log2 (Cy5/Cy3) ratio of the CGH signal, amid a 5 kb window, reached a threshold of 0.6, indicating a duplication. The graphical normalized data for each patient was obtained by applying the most distal and proximal oligonucleotide genomic probe coordinates to the custom track at UCSC site http://genome.ucsc.edu/cgi-bin/hgGateway. Positions are given relative to NCBI Build 35 for the X chromosome. The blue region represents triplicated regions. ‘Complex rearrangements’ refers to array results from those patients who presented duplicated regions interrupted by non-duplicated regions as well as duplicated regions interrupted by triplicated regions. Eight out of 30 (27%) in our cohort were found to have complex rearrangements by array CGH. The Smallest Region of Overlap (SRO) is 149 kb and contains two genes, IRAK1 and MECP2. Note BAB2626 and BAB2628 have the same size duplication, as expected since they are affected sibs who share the same mother. (B) Agilent 4X44K oligoarray CGH results for the eight patients (plus mothers in five cases) carrying complex rearrangements. Red lines above the diagram represent duplicated segments, blue lines represent triplicated segments and green lines represent normal copy number stretches of DNA contained within duplicated sequences. The gaps between the lines represent intervals where we could not infer the copy number status due to poor probe coverage secondary to LCRs. The complexities were inherited from the mother as shown by oligonucleotide array CGH in five cases. (C) FISH detection of MECP2 triplication in male patient BAB2801 and in his mother using RP11-119A22 clone containing the MECP2 gene (red signal) and RP11-137H15 (green signal) as control; that result confirms the triplication revealed by oligonucleotide array CGH.
Figure 2.
Figure 2.
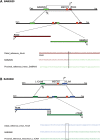
Breakpoints/join points group near or at the SDs around the MECP2 gene. (A) Solid red bars represent duplicated regions and blue bars represent triplicated regions. LCR J spans 114 kb and is formed by three genes that constitute the Opsin array, OPN1LW and OPN1MW, arranged in head-to-tail tandem array interrupted by copies of TEX28. The nearby LCRs, K1 and K2, are positioned in inverted orientation, have 99% sequence identity and are 11.3 kb in length. Hatched bars represent intervals with poor probe coverage. The red and dark green arrows point out, respectively, the genomic coordinates of the observed and the expected average distal breakpoint as calculated by the Monte Carlo algorithm. (B) Scatter plot of the results of the Monte Carlo simulation with the two summary outcomes shown. The red dot represents the average distal breakpoint for our cohort; black dots show the distribution of 10 000 replicate Monte Carlo simulations. Y-axis: variance distribution of the segment locations; X-axis: location of the calculated average distal breakpoints. Positions are given relative to NCBI Build 35 for the X chromosome.
Figure 3.
Figure 3.
(AC) Breakpoints/Join points of the duplications in patients BAB2629, BAB2688, BAB2770, respectively. Reference and rearranged genomic structures are shown. The duplicated region is boxed with a black rectangle. Primers used to obtain breakpoint junctions by long-range PCR are shown (F and R). Colored rectangles expanded by dotted lines represent the proximal and distal breakpoint areas. The breakpoint/join point is expanded and the sequence is aligned to the distal and proximal genomic references (to facilitate visualization sequence colors match the colored rectangles). The microhomologies, are boxed. Inserted nucleotides are written in black. The repetitive elements present near or at the join points are underlined and their sequences italicized. Patient BABA2629 has no microhomology; the thin rectangle represents the breakpoint junction location. (D) Complex rearrangements observed for BAB2727. The duplicated region is boxed in the black rectangle and the triplicated/inverted region is boxed in the blue rectangle. Primers used to obtain the breakpoint junctions by long-range PCR are shown (R and R). We sequenced two out of three join points (represented as FoSTeS × 1, ×2 and ×3), enlarged below. All sequences are aligned to the distal and proximal genomic references in anti-sense orientation except the light green one for the Proximal_reference_intron_ARHGAP4, which is in sense orientation (representing the join point sequence as we observed). A complete alignment of this join point is available as Supplementary Material, Figure S1. (E) Predicted order, origins, and relative orientations of duplicated/triplicated sequences for patient BAB2727. Arrowheads show direction of DNA relative to the positive strand; circled numbers represent a FoSTeS event. Asterisk (*) indicates a non-sequenced join junction.
Figure 3.
Figure 3.
(AC) Breakpoints/Join points of the duplications in patients BAB2629, BAB2688, BAB2770, respectively. Reference and rearranged genomic structures are shown. The duplicated region is boxed with a black rectangle. Primers used to obtain breakpoint junctions by long-range PCR are shown (F and R). Colored rectangles expanded by dotted lines represent the proximal and distal breakpoint areas. The breakpoint/join point is expanded and the sequence is aligned to the distal and proximal genomic references (to facilitate visualization sequence colors match the colored rectangles). The microhomologies, are boxed. Inserted nucleotides are written in black. The repetitive elements present near or at the join points are underlined and their sequences italicized. Patient BABA2629 has no microhomology; the thin rectangle represents the breakpoint junction location. (D) Complex rearrangements observed for BAB2727. The duplicated region is boxed in the black rectangle and the triplicated/inverted region is boxed in the blue rectangle. Primers used to obtain the breakpoint junctions by long-range PCR are shown (R and R). We sequenced two out of three join points (represented as FoSTeS × 1, ×2 and ×3), enlarged below. All sequences are aligned to the distal and proximal genomic references in anti-sense orientation except the light green one for the Proximal_reference_intron_ARHGAP4, which is in sense orientation (representing the join point sequence as we observed). A complete alignment of this join point is available as Supplementary Material, Figure S1. (E) Predicted order, origins, and relative orientations of duplicated/triplicated sequences for patient BAB2727. Arrowheads show direction of DNA relative to the positive strand; circled numbers represent a FoSTeS event. Asterisk (*) indicates a non-sequenced join junction.
Figure 4.
Figure 4.
Alignment of the join points to the genomic locations of each FoSTeS in the context of regional LCRs. Positions are given relative to NCBI Build 35 for the X chromosome. Rearrangements reported previously in the literature are represented in different color rectangles above the figure (refer to the text for further details).

References

    1. Meins M., Lehmann J., Gerresheim F., Herchenbach J., Hagedorn M., Hameister K., Epplen J.T. Submicroscopic duplication in Xq28 causes increased expression of the MECP2 gene in a boy with severe mental retardation and features of Rett syndrome. J. Med. Genet. 2005;42:e12. - PMC - PubMed
    1. Van Esch H., Bauters M., Ignatius J., Jansen M., Raynaud M., Hollanders K., Lugtenberg D., Bienvenu T., Jensen L.R., Gecz J., et al. Duplication of the MECP2 region is a frequent cause of severe mental retardation and progressive neurological symptoms in males. Am. J. Hum. Genet. 2005;77:442–453. - PMC - PubMed
    1. del Gaudio D., Fang P., Scaglia F., Ward P.A., Craigen W.J., Glaze D.G., Neul J.L., Patel A., Lee J.A., Irons M., et al. Increased MECP2 gene copy number as the result of genomic duplication in neurodevelopmentally delayed males. Genet. Med. 2006;8:784–792. - PubMed
    1. Friez M.J., Jones J.R., Clarkson K., Lubs H., Abuelo D., Bier J.A., Pai S., Simensen R., Williams C., Giampietro P.F., et al. Recurrent infections, hypotonia, and mental retardation caused by duplication of MECP2 and adjacent region in Xq28. Pediatrics. 2006;118:e1687–e1695. - PubMed
    1. Gu W., Lupski J.R. CNV and nervous system disease - what’s new? Cytogenet. Genome Res. 2008;123:54–64. - PMC - PubMed

Publication types

Substances