

Induction of CCL20 production by Kaposi sarcoma-associated herpesvirus: role of viral FLICE inhibitory protein K13-induced NF-kappaB activation
- PMID: 19324905
- PMCID: PMC2689059
- DOI: 10.1182/blood-2008-10-186403
Induction of CCL20 production by Kaposi sarcoma-associated herpesvirus: role of viral FLICE inhibitory protein K13-induced NF-kappaB activation
Abstract
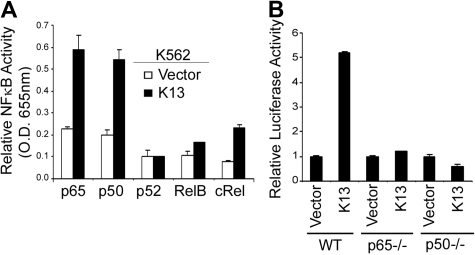
Kaposi sarcoma-associated herpesvirus (KSHV), also known as human herpesvirus 8, is the etiologic agent of Kaposi sarcoma (KS), an angioproliferative lesion characterized by dramatic angiogenesis and inflammatory infiltration. In this study, we report that expression of chemokine CCL20, a potent chemoattractant of dendritic cells and lymphocytes, is strongly induced in cultured cells either by KSHV infection or on ectopic expression of viral FLICE inhibitory protein K13. This induction is caused by transcriptional activation of CCL20 gene, which is mediated by binding of the p65, p50, and c-Rel subunits of the transcription factor nuclear factor-kappaB (NF-kappaB) to an atypical NF-kappaB-binding site present in the CCL20 gene promoter. The CCL20 gene induction is defective in K13 mutants that lack NF-kappaB activity, and can be blocked by specific genetic and pharmacologic inhibitors of the NF-kappaB pathway. CCR6, the specific receptor for CCL20, is also induced in cultured cells either by KSHV infection or on K13 expression. Finally, expression of CCL20 and CCR6 is increased in clinical samples of KS. These results suggest that KSHV and K13-mediated induction of CCL20 and CCR6 may contribute to the recruitment of dendritic cells and lymphocytes into the KS lesions, and to tumor growth and metastases.
Figures


Similar articles
-
A20 is induced by Kaposi sarcoma-associated herpesvirus-encoded viral FLICE inhibitory protein (vFLIP) K13 and blocks K13-induced nuclear factor-kappaB in a negative feedback manner.J Biol Chem. 2011 Jun 17;286(24):21555-64. doi: 10.1074/jbc.M111.224048. Epub 2011 Apr 29. J Biol Chem. 2011. PMID: 21531730 Free PMC article.
-
Kaposi's sarcoma-associated herpesvirus-encoded viral FLICE inhibitory protein (vFLIP) K13 suppresses CXCR4 expression by upregulating miR-146a.Oncogene. 2010 Mar 25;29(12):1835-44. doi: 10.1038/onc.2009.460. Epub 2009 Dec 21. Oncogene. 2010. PMID: 20023696 Free PMC article.
-
A20/TNFAIP3 inhibits NF-κB activation induced by the Kaposi's sarcoma-associated herpesvirus vFLIP oncoprotein.Oncogene. 2013 Mar 7;32(10):1223-32. doi: 10.1038/onc.2012.145. Epub 2012 Apr 23. Oncogene. 2013. PMID: 22525270 Free PMC article.
-
Transcriptional regulation of CCL20 expression.Microbes Infect. 2014 Oct;16(10):864-70. doi: 10.1016/j.micinf.2014.08.005. Epub 2014 Aug 14. Microbes Infect. 2014. PMID: 25130722 Review.
-
Endothelial cell- and lymphocyte-based in vitro systems for understanding KSHV biology.Curr Top Microbiol Immunol. 2007;312:211-44. doi: 10.1007/978-3-540-34344-8_8. Curr Top Microbiol Immunol. 2007. PMID: 17089799 Review.
Cited by
-
c-FLIP-Short reduces type I interferon production and increases viremia with coxsackievirus B3.PLoS One. 2014 May 9;9(5):e96156. doi: 10.1371/journal.pone.0096156. eCollection 2014. PLoS One. 2014. PMID: 24816846 Free PMC article.
-
Kaposi's sarcoma-associated herpesvirus oncoprotein K13 protects against B cell receptor-induced growth arrest and apoptosis through NF-κB activation.J Virol. 2013 Feb;87(4):2242-52. doi: 10.1128/JVI.01393-12. Epub 2012 Dec 12. J Virol. 2013. PMID: 23236068 Free PMC article.
-
Cyclooxygenase-2-prostaglandin E2-eicosanoid receptor inflammatory axis: a key player in Kaposi's sarcoma-associated herpes virus associated malignancies.Transl Res. 2013 Aug;162(2):77-92. doi: 10.1016/j.trsl.2013.03.004. Epub 2013 Apr 6. Transl Res. 2013. PMID: 23567332 Free PMC article. Review.
-
A computational profiling of changes in gene expression and transcription factors induced by vFLIP K13 in primary effusion lymphoma.PLoS One. 2012;7(5):e37498. doi: 10.1371/journal.pone.0037498. Epub 2012 May 18. PLoS One. 2012. PMID: 22624040 Free PMC article.
-
Transcriptome analysis based on RNA-seq of common innate immune responses of flounder cells to IHNV, VHSV, and HIRRV.PLoS One. 2020 Sep 28;15(9):e0239925. doi: 10.1371/journal.pone.0239925. eCollection 2020. PLoS One. 2020. PMID: 32986779 Free PMC article.
References
-
- Ensoli B, Sturzl M. Kaposi's sarcoma: a result of the interplay among inflammatory cytokines, angiogenic factors and viral agents. Cytokine Growth Factor Rev. 1998;9:63–83. - PubMed
-
- Ensoli B, Gallo RC. AIDS-associated Kaposi's sarcoma: a new perspective of its pathogenesis and treatment. Proc Assoc Am Physicians. 1995;107:8–18. - PubMed
-
- Masood R, Cai J, Law R, Gill P. AIDS-associated Kaposi's sarcoma pathogenesis, clinical features, and treatment. Curr Opin Oncol. 1993;5:831–834. - PubMed
-
- Ensoli B, Sgadari C, Barillari G, Sirianni MC, Sturzl M, Monini P. Biology of Kaposi's sarcoma. Eur J Cancer. 2001;37:1251–1269. - PubMed
-
- Dorfman RF. The histogenesis of Kaposi's sarcoma. Lymphology. 1984;17:76–77. - PubMed
Publication types
MeSH terms
Substances
Grants and funding
LinkOut - more resources
Full Text Sources
Research Materials
