. 2009 Mar 27;323(5922):1726-9.
doi: 10.1126/science.1168676.

Visualizing antigen-specific and infected cells in situ predicts outcomes in early viral infection

Affiliations

Visualizing antigen-specific and infected cells in situ predicts outcomes in early viral infection

Qingsheng Li et al. Science. .

Abstract

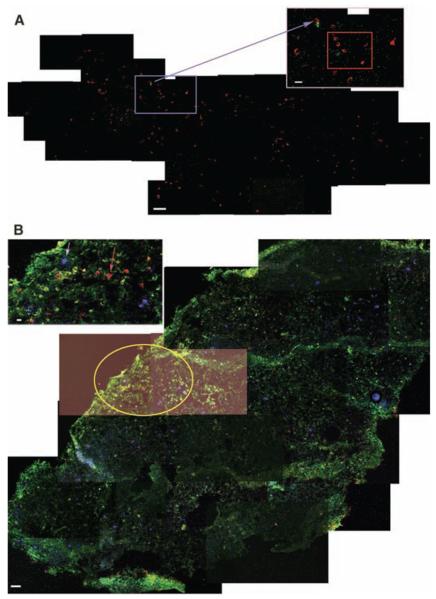
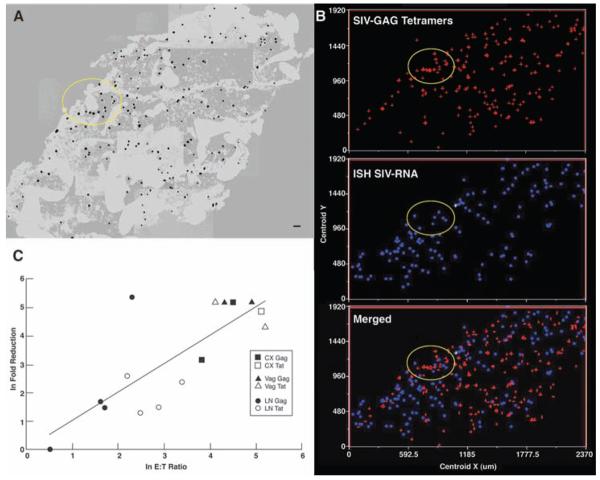
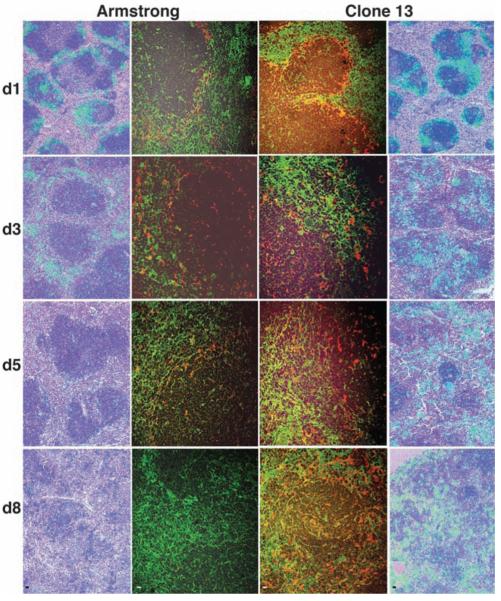
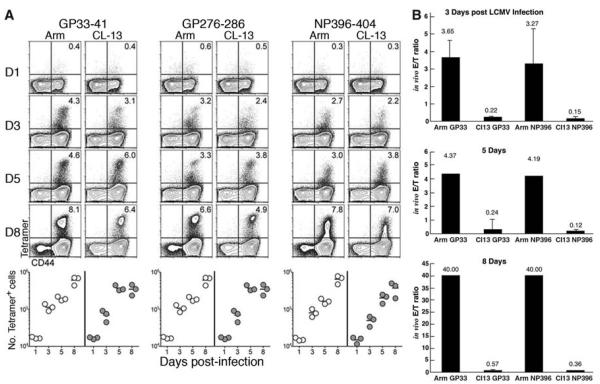
In the early stages of viral infection, outcomes depend on a race between expansion of infection and the immune response generated to contain it. We combined in situ tetramer staining with in situ hybridization to visualize, map, and quantify relationships between immune effector cells and their targets in tissues. In simian immunodeficiency virus infections in macaques and lymphocytic choriomeningitis virus infections in mice, the magnitude and timing of the establishment of an excess of effector cells versus targets were found to correlate with the extent of control and the infection outcome (i.e., control and clearance versus partial or poor control and persistent infection). This method highlights the importance of the location, timing, and magnitude of the immune response needed for a vaccine to be effective against agents of persistent infection, such as HIV-1.


Figures

Fig. 1
Fig. 1
ISTH analysis. (A) Cervical tissues, 21 dpi. The image of a whole section of cervix was reconstructed as a montage in Photoshop from separate confocal images, using the red channel for the Gag-tetramer+ cells and green for the SIV RNA+ cells. The blue arrow from the region enclosed by the blue rectangle points to a red Gag-tetramer+ cell–green SIV RNA+ cell conjugate in the enlarged inset. The excess of Gag-tetramer+ cells is shown in the inset in a region enclosed by the red rectangle. (B)Lymphatic tissues, 21 dpi. Montage of a whole lymph node section reconstructed in Photoshop from separate images, using the red channel for the Gagtetramer+ cells, blue for the SIV RNA+ cells, and green for CD8+ T cells. The red arrow in the enlarged inset (upper left) points to a red Gagtetramer+ cell; the light blue arrow points to a blue SIV RNA+ cell. The two lightened separate images with an encircled distinctive V-shaped constellation of Gag-tetramer+ cells provide a frame of reference for Fig. 2. Scale bars for whole sections, 50 μm; insets, 10 μm.
Fig. 2
Fig. 2
Spatial relationships between SIVtetramer+ and SIV RNA+ cells in the lymph node shown in Fig. 1B, andrelationshipbetween E:T ratios and reduction in viral replication. (A)Gagtetramer+ cells are shown against a gray-white mask of the section, with the V-shaped encircled constellation shown in Fig. 1B. Scale bar, 50 μm. (B)SIVRNA+ and tetramer+ cells were mapped by plotting the x and y coordinates of their centers (centroids) onto a two-dimensional grid measured from a fixed starting position (0,0). Upper panel, Gag-tetramer+ cells; middle panel, SIV RNA+ cells; lower panel, superimposition of upper and middle panels revealing the close spatial proximity of the virus-specific tetramer+ cells with SIV RNA+ throughout the lymph node. The white crosses and encircled areas in the panels are included as points of reference. (C) E:T ratio correlates with reduction in viral load in cervical vaginal and lymphatic tissues. Natural log–transformed viral load fold reductions are plotted against E:T ratios for Gag- and Tat-tetramer+ cells in cervical (CX) and vaginal (Vag) tissues and lymph nodes (LN) from five animals at 20 to 28 dpi. E:T ratios were determined by ISH as described (13).
Fig. 3
Fig. 3
Time course comparison of cells infected by LCMV-Armstrong or LCMV-clone 13. Outer columns: LCMV RNA+ cells detected by ISH with LCMV-specific probes have a greenish appearance in developed radioautographs viewed in reflected light. Spleen white pulp is counterstained dark blue. Inner columns: LCMV-antigen+ cells are stained red with polyclonal antibody to LCMV; FRCs in white pulp are stained green with the FRC marker ER-TR7. Both viral strains at 1 dpi (d1) infect macrophages in the marginal zone and FRCs in the white pulp, but LCMV–clone 13 infects larger numbers of both cell types. LCMV–clone 13 continues to infect large numbers of both cell types over the 8-day time course of the experiment, whereas the numbers of infected cells rapidly decline in LCMV-Armstrong infections. Scale bars (bottom row), 10 μm.
Fig. 4
Fig. 4
(A) FACS analysis of the immunodominant epitope response to acute LCMV-Armstrong and LCMV–clone 13 infections in spleen. Flow cytometric quantification is presented as proportions and numbers of stained tetramer+ cells from disaggregated spleens from groups of three mice per time point after LCMV-Armstrong or LCMV– clone 13 infection. Representative plots gated on CD8+ T cells are shown by MHC class I tetramer (y axis) for each immunodominant epitope (GP33-41, GP276-286, and NP396-404) and CD44 (x axis). (B)E:Tratios in acute LCMV-Armstrong and LCMV-clone 13 infections in spleen. E:T ratios at the times shown were determined by ISTH as described (13).

Similar articles

Cited by

References

    1. Doherty PC. Science. 1998;280:227. - PubMed
    1. Koup RA, et al. J. Virol. 1994;68:4650. - PMC - PubMed
    1. Kuroda MJ, et al. J. Immunol. 1999;162:5127. - PubMed
    1. Davenport MP, Ribeiro RM, Perelson AS. J. Virol. 2004;78:10096. - PMC - PubMed
    1. Haase AT. Nat. Rev. Immunol. 2005;5:783. - PubMed

Publication types

MeSH terms