. 2009 Mar 11:3:4.
doi: 10.3389/neuro.10.004.2009. eCollection 2009.

Neurophysiological bases of exponential sensory decay and top-down memory retrieval: a model

Affiliations

Neurophysiological bases of exponential sensory decay and top-down memory retrieval: a model

Ariel Zylberberg et al. Front Comput Neurosci. .

Abstract

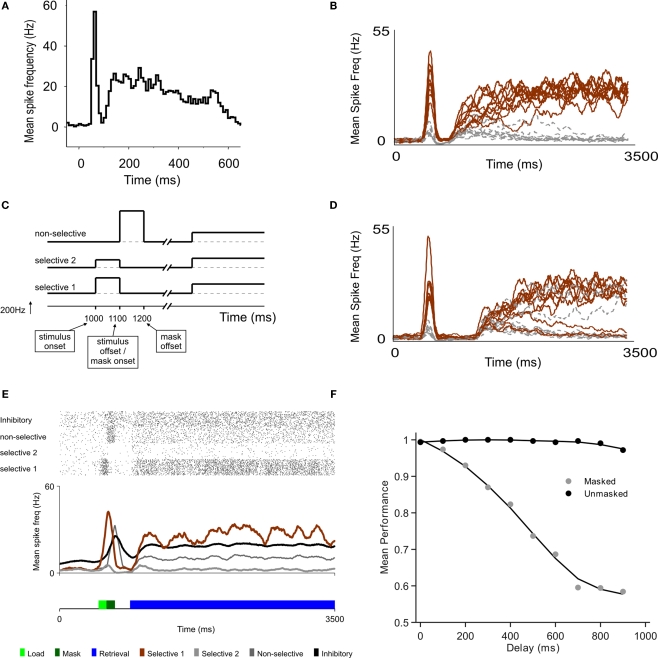
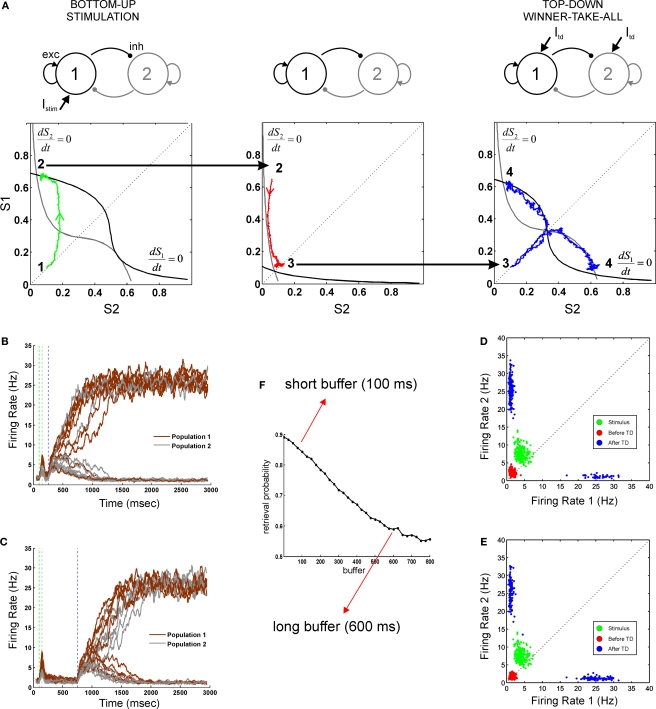
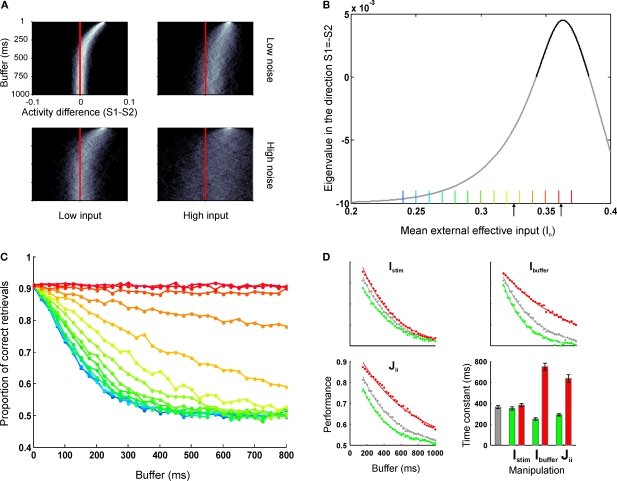
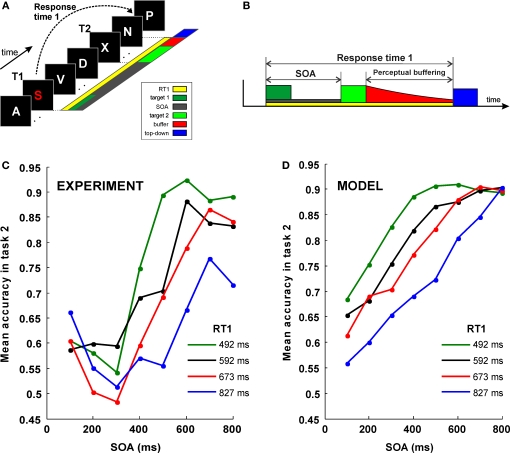
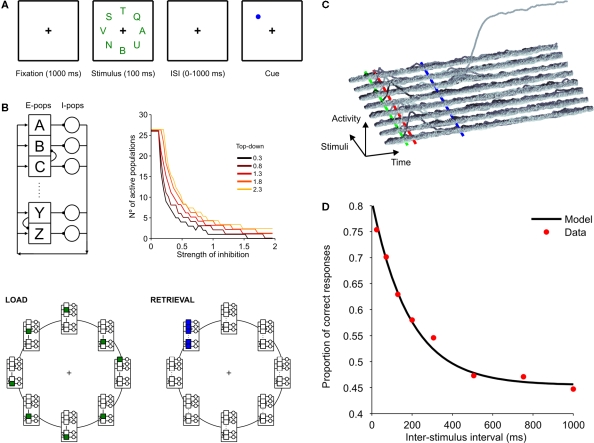
Behavioral observations suggest that multiple sensory elements can be maintained for a short time, forming a perceptual buffer which fades after a few hundred milliseconds. Only a subset of this perceptual buffer can be accessed under top-down control and broadcasted to working memory and consciousness. In turn, single-cell studies in awake-behaving monkeys have identified two distinct waves of response to a sensory stimulus: a first transient response largely determined by stimulus properties and a second wave dependent on behavioral relevance, context and learning. Here we propose a simple biophysical scheme which bridges these observations and establishes concrete predictions for neurophsyiological experiments in which the temporal interval between stimulus presentation and top-down allocation is controlled experimentally. Inspired in single-cell observations, the model involves a first transient response and a second stage of amplification and retrieval, which are implemented biophysically by distinct operational modes of the same circuit, regulated by external currents. We explicitly investigated the neuronal dynamics, the memory trace of a presented stimulus and the probability of correct retrieval, when these two stages were bracketed by a temporal gap. The model predicts correctly the dependence of performance with response times in interference experiments suggesting that sensory buffering does not require a specific dedicated mechanism and establishing a direct link between biophysical manipulations and behavioral observations leading to concrete predictions.

Keywords: attentional blink; attractor networks; dual-task interference; iconic memory; stochastic processes.


Figures

Figure 1
Figure 1
A model of sensory decay and top-down memory retrieval. (A) Neural recording in area V1 from a monkey performing a contour grouping task (Li et al., 2006), showing a first initial transient followed by a second wave of delayed activations. (B) Two-stage responses in a recurrent model of cortical processing. Top-down control, which sets the circuit in a winner-take-all mode, is directed to the network 300 ms after stimulus offset. The average firing rate of selective (brown) and non-selective (grey) populations are plotted (firing rates are averaged in causal windows of 100 ms and sliding steps of 5 ms). (C) Schematic time course of input signals. The model is submitted to a series of two stages, defined by the particular configuration of external currents (top-down, bottom-up). In the first stage, which corresponds to the bottom-up stimulation generated by stimulus presentation, external inputs are increased for both populations of selective neurons, in 240 Hz for the population with higher selectivity and in 120 Hz for the population with lower selectivity. This stimulation lasts 100 ms and is followed by a mask, which is modeled as a stimulation of non-selective cells also during 100 ms. In the second stage, after a delay which is under experimental control, top-down control is directed to the network, modeled as a constant input to all excitatory cells. (D) Predicted neural activations of an electrophysiological experiment that has not been done, bracketing stimulus presentation and top-down control. The duration of the buffer is 700 ms. (E) The excitatory neurons are divided in those selective to target 1, to target 2, and non-selective. Visual masking (dark green box) is represented as a stimulation of excitatory non-selective cells that through shared inhibitory connections increase the decay rate of the stimulus trace. A raster plot of representative (randomly selected) neurons of all populations is shown, as well as the average activity of each group. (F) Proportion of correct retrievals as a function of the duration of the perceptual buffer, for trials with and without backwards mask.
Figure 2
Figure 2
Neural dynamics as a concatenation of discrete processing stages. (A) Sketch of the mean-field architecture and trajectories in phase space. Output synaptic gating variables are plotted against each other. Nullclines for S1 and S2 are plotted in black and grey, respectively. When the stimulus is presented, the system evolves towards the high S1/low S2 asymmetrical attractor. During the buffer, the fixed point in the quiescent state becomes stable and the system evolves towards this fixed point. Top-down control reconfigures the phase space, forcing the system to one of the two high-level attractors. Two trajectories are plotted from the same initial point, giving one correct and one incorrect response. (B,C) Time course of firing rates for short (B) and long (C) buffers. Firing rates are constructed averaging activity over windows of 25 ms, with sliding steps of 5 ms. Red, green, and blue dotted lines indicate load onset, load offset, and retrieval onset, respectively. (D,E) Each processing stage can be understood as a stochastic map in phase space as seen by the distributions of the final states (200 trials) of each processing stage (load, before top-down and after top-down, in green, red and blue, respectively). Each data point indicates the average activity (firing rate) of the last 12.5 ms of the corresponding phase, for short (D) and long (E) buffers. (F) Percent of correct retrievals as a function of the duration of the buffer. Each point is the average over 10,000 trials.
Figure 3
Figure 3
The dynamics of error and correct responses during memory decay and retrieval. (A) We explored the progression of the distance to the decision boundary during the buffer. The four panels represent a factorial exploration of the effects of background current during the buffer [low (left column) and high (right column) input currents] and the noise level [low (top panels) and high noise (bottom panels)]. Within each panel, each line represents a histogram, coded in a grey color code. The y-axis indicates buffer time and the x-axis indicates the difference in activity between S1 and S2. In all panels it can be seen that in the beginning of the buffer activity is clustered in a value of (S1S2) (the initial condition had no dispersion) and as time passes (going down in the y-axis) the distribution probability approaches the decision boundary and becomes wider. (B) The speed of convergence to the decision boundary can be estimated by calculating the eigenvalue of the quiescent fix point in the linearized system as a function of the background input currents. For high background currents – just bellow the bifurcation – speeds are arbitrarily slow (stimulus memory is lost by noise diffusion). For lower currents, the speed increases (in absolute value) reaching an asymptote which establishes a maximal rate of convergence and thus a minimal temporal decay constant. This critical time is determined by the NMDA temporal constant and determines that perceptual buffers last at least about 100 ms. The current values which correspond to the retrieval mode (positive eigenvalue) are indicated in bold. Black arrows indicate the default values used as background currents during buffer (I0 = 0.3255 nA) and retrieval (I0 = 0.3619 nA) throughout the paper. (C) Simulations of a sensory retrieval experiment using the original (non-linear) system of equations, varying the duration of the buffer and the background current during the buffer. Information is lost exponentially with a time constant which increases with increasing currents and has a lower bound. Each curve is the average over 5,000 trials. Each color represents a different input value, as indicated in Figure 2B. Values range from 0.24 to 0.37 nA, in intervals of 0.01 nA. (D) Effect of different parameter manipulations on task performance: stimulus intensity (Istim, upper left panel), top-down currents during the buffer (Ibuffer, upper-right panel), and recurrent strength (Jii, lower left panel). The baseline (same as data in Figure 2F) is plotted in gray. Higher values are plotted in red and lower values in green. Data is fitted with exponential distributions. Error bars indicate 95% confidence bounds.
Figure 4
Figure 4
Simulation of a dual-task interference experiment. (A) Sketch of the “speeded attentional blink” paradigm used by Jolicoeur (1999): letters are presented in rapid serial visual presentation (RSVP), each letter presented for 100 ms with no blank ISI. Subject must report both T1 and T2. T1 must be reported as soon as possible, while T2 is reported at the end of the trial, without time pressure. SOA is systematically varied in order to study its effect on T2 accuracy. (B) A schematic model of interference based on sequential top-down allocation. Top-down allocation to T2 can only occur once it has been released from T1 and thus the duration of the sensory buffer is determined by RT1 − SOA − P. (C) Mean accuracy in task 2 for different SOA, as obtained by (Jolicoeur, 1999). The proportion of trials where T2 was correctly identified (given T1 correct) is plotted against SOA (in milliseconds). Results are grouped in four categories according to the response time to the first task (RT1). Mean RT1 is indicated. (D) Result of the simulations of the model after averaging 1,000 trials for each condition.
Figure 5
Figure 5
Simulation of a partial report experiment. (A) Sketch of the partial report experiment (Graziano and Sigman, 2008). Eight letters appeared simultaneously for 106 ms on a computer screen, arranged on a circle (5.5°) around the fixation point. Each letter was presented in uppercases and chosen at random from a set of 26 letters. Trials started with a fixation point at the center of the display. After 1,000 ms, the array of eight letters was shown for 106 ms. After removal of the array of letters participants were cued with a color marker at the location of the letter that had to be reported. The cue was maintained on the screen until participants made a forced choice. Eight target-cue asynchronies (ISI) were investigated: the cue appeared 24, 71, 129, 200, 306, 506, 753, 1,000 ms after the offset of the array display. (B) Description of the network and of the model. Each letter is represented by a variable with a normalized output in the range (0, 1). For simplicity, we neglect any interaction between letters in different positions of the stimulus array and thus the eight different locations are modeled independently. The network is endowed with local excitatory connection – each excitatory population connects to one inhibitory population – and global inhibition – each inhibitory population projects uniformly to all excitatory populations. The number of active populations in the stable state decreases with the inverse of inhibition strength and increases with top-down strength. This dependency assures that a wide range of parameters exists for which the network is set in a winner-take-all mode (i.e. retrieves a single population). In each location, only one population receives bottom-up input during stimulus presentation (green populations in the lower-left panel). During retrieval, all excitatory populations receive equal top-down currents (blue populations in the lower-right panel). (C) Transient responses to the stimuli and top-down amplification at the target location. In each position, the activity of the 26 possible responses (letters) is plotted. Top-down current sets a winner-take-all competition at target location, where the initial transient response biases the competition towards the presented letter. Stimulus onset, stimulus offset, and cue onset are marked with green, red and blue lines respectively. (D) Performance for human subjects (red dots) and model (black line). Solid curve was obtained by fitting model simulations to an exponential distribution (R2 > 0.995). Data for the fit was obtained by averaging 3,000 simulations at each of 43 inter-stimulus-cue intervals (from 0 to 1,050 ms at intervals of 25 ms).

Similar articles

Cited by

References

    1. Abbott L. F., Chance F. S. (2005). Drivers and modulators from push-pull and balanced synaptic input. Prog. Brain Res. 149, 147.10.1016/S0079-6123(05)49011-1 - DOI - PubMed
    1. Amit D. J., Brunel N. (1997). Model of global spontaneous activity and local structured activity during delay periods in the cerebral cortex. Cereb. Cortex 7, 237–25210.1093/cercor/7.3.237 - DOI - PubMed
    1. Ardid S., Wang X. J., Compte A. (2007). An integrated microcircuit model of attentional processing in the neocortex. J. Neurosci. 27, 8486–849510.1523/JNEUROSCI.1145-07.2007 - DOI - PMC - PubMed
    1. Averbach E., Coriell A. S. (1961). Short-term memory in vision. Bell Syst. Tech. J. 40, 309–328
    1. Baars B. J. (1989). A Cognitive Theory of Consciousness. Cambridge, Cambridge University Press