

Hypertrophy and/or Hyperplasia: Dynamics of Adipose Tissue Growth
- PMID: 19325873
- PMCID: PMC2653640
- DOI: 10.1371/journal.pcbi.1000324
Hypertrophy and/or Hyperplasia: Dynamics of Adipose Tissue Growth
Abstract
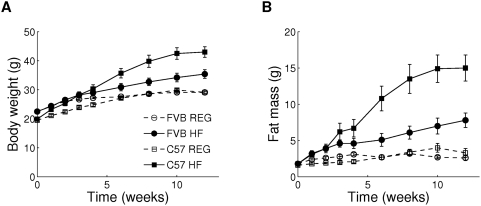
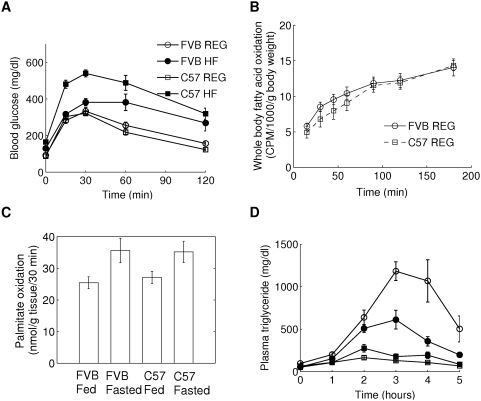
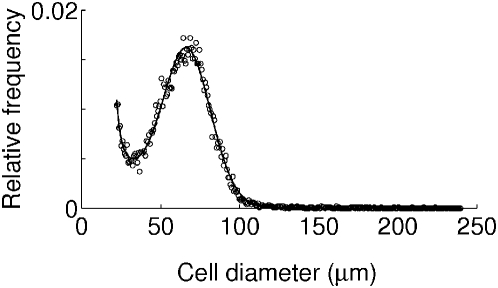
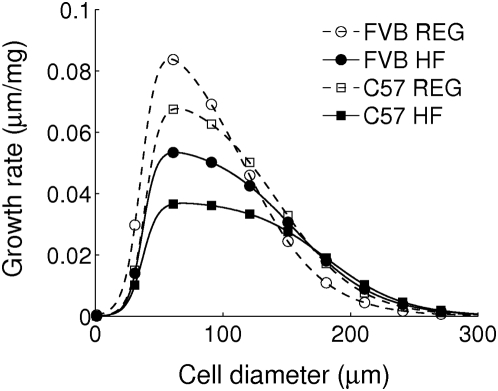
Adipose tissue grows by two mechanisms: hyperplasia (cell number increase) and hypertrophy (cell size increase). Genetics and diet affect the relative contributions of these two mechanisms to the growth of adipose tissue in obesity. In this study, the size distributions of epididymal adipose cells from two mouse strains, obesity-resistant FVB/N and obesity-prone C57BL/6, were measured after 2, 4, and 12 weeks under regular and high-fat feeding conditions. The total cell number in the epididymal fat pad was estimated from the fat pad mass and the normalized cell-size distribution. The cell number and volume-weighted mean cell size increase as a function of fat pad mass. To address adipose tissue growth precisely, we developed a mathematical model describing the evolution of the adipose cell-size distributions as a function of the increasing fat pad mass, instead of the increasing chronological time. Our model describes the recruitment of new adipose cells and their subsequent development in different strains, and with different diet regimens, with common mechanisms, but with diet- and genetics-dependent model parameters. Compared to the FVB/N strain, the C57BL/6 strain has greater recruitment of small adipose cells. Hyperplasia is enhanced by high-fat diet in a strain-dependent way, suggesting a synergistic interaction between genetics and diet. Moreover, high-fat feeding increases the rate of adipose cell size growth, independent of strain, reflecting the increase in calories requiring storage. Additionally, high-fat diet leads to a dramatic spreading of the size distribution of adipose cells in both strains; this implies an increase in size fluctuations of adipose cells through lipid turnover.
Conflict of interest statement
The authors have declared that no competing interests exist.
Figures
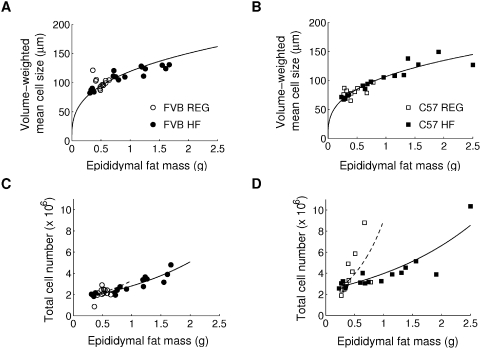
 and volume-weighted mean cell size
  is fitted with a power law
  with (A)
  and (B)
  , which is plotted with solid lines. (C) and (D): the correlation between epididymal fat pad mass
  and total cell number
  is fitted into an exponential function
  with initial fat pad mass
  , initial cell number
  , and cell-number increasing rate
  , plotted with dashed lines (chow diet) and solid lines (high-fat diet). Fitted parameter values are summarized in Table 2.
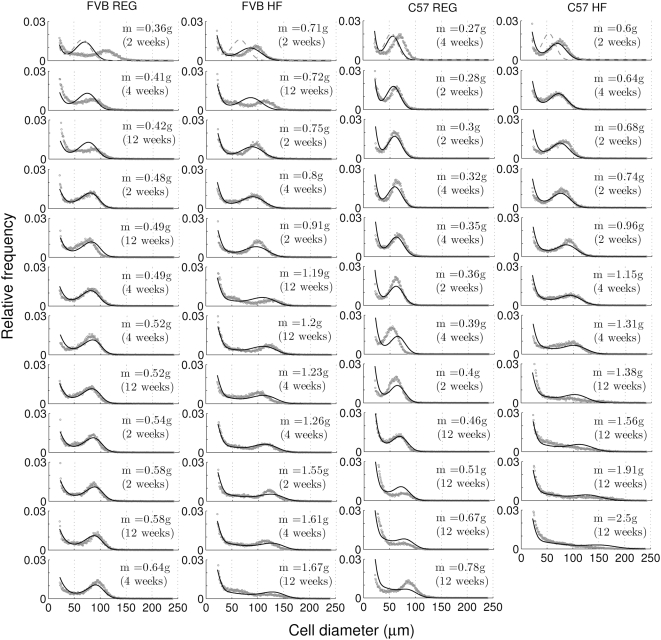
References
-
- Marti A, Martinez-Gonzalez MA, Martinez JA. Interaction between genes and lifestyle factors on obesity. Proc Nutr Soc. 2008;67:1–8. - PubMed
-
- Barsh GS, Farooqi IS, O'Rahilly S. Genetics of body-weight regulation. Nature. 2000;404:644–651. - PubMed
-
- Almind K, Kahn CR. Genetic determinants of energy expenditure and insulin resistance in diet-induced obesity in mice. Diabetes. 2004;53:3274–3285. - PubMed
-
- Comuzzie AG, Allison DB. The search for human obesity genes. Science. 1998;280:1374–1377. - PubMed
-
- Johnson PR, Hirsch J. Cellularity of adipose depots in six strains of genetically obese mice. J Lipid Res. 1972;13:2–11. - PubMed
Publication types
MeSH terms
Substances
Grants and funding
LinkOut - more resources
Full Text Sources
Other Literature Sources
Medical
