Evidence for protein conformational change at a Au(110)/protein interface
- PMID: 19325933
- PMCID: PMC2660841
- DOI: 10.1209/0295-5075/83/18004
Evidence for protein conformational change at a Au(110)/protein interface
Abstract
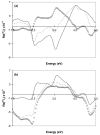
Evidence is presented that reflection anisotropy spectroscopy (RAS) can provide real-time measurements of conformational change in proteins induced by electron transfer reactions. A bacterial electron transferring flavoprotein (ETF) has been modified so as to adsorb on an Au(110) electrode and enable reversible electron transfer to the protein cofactor in the absence of mediators. Reversible changes are observed in the RAS of this protein that are interpreted as arising from conformational changes accompanying the transfer of electrons.
Figures


Similar articles
-
Electron transfer and conformational change in complexes of trimethylamine dehydrogenase and electron transferring flavoprotein.J Biol Chem. 2002 Mar 8;277(10):8457-65. doi: 10.1074/jbc.M111105200. Epub 2001 Dec 27. J Biol Chem. 2002. PMID: 11756429
-
Probing the dynamic interface between trimethylamine dehydrogenase (TMADH) and electron transferring flavoprotein (ETF) in the TMADH-2ETF complex: role of the Arg-alpha237 (ETF) and Tyr-442 (TMADH) residue pair.Biochemistry. 2008 May 6;47(18):5168-81. doi: 10.1021/bi800127d. Epub 2008 Apr 12. Biochemistry. 2008. PMID: 18407658
-
Conformational change induced by electron transfer in a monolayer of cytochrome P450 reductase adsorbed at the Au(110)-phosphate buffer interface.Phys Rev E Stat Nonlin Soft Matter Phys. 2013 Sep;88(3):032715. doi: 10.1103/PhysRevE.88.032715. Epub 2013 Sep 26. Phys Rev E Stat Nonlin Soft Matter Phys. 2013. PMID: 24125302
-
Flavin radicals, conformational sampling and robust design principles in interprotein electron transfer: the trimethylamine dehydrogenase-electron-transferring flavoprotein complex.Biochem Soc Symp. 2004;(71):1-14. doi: 10.1042/bss0710001. Biochem Soc Symp. 2004. PMID: 15777008 Review.
-
Dynamics driving function: new insights from electron transferring flavoproteins and partner complexes.FEBS J. 2007 Nov;274(21):5481-504. doi: 10.1111/j.1742-4658.2007.06107.x. Epub 2007 Oct 17. FEBS J. 2007. PMID: 17941859 Review.
Cited by
-
The influence of the structure of the Au(110) surface on the ordering of a monolayer of cytochrome P450 reductase at the Au(110)/phosphate buffer interface.Phys Status Solidi B Basic Solid State Phys. 2014 Mar 1;251(3):549-554. doi: 10.1002/pssb.201350063. Phys Status Solidi B Basic Solid State Phys. 2014. PMID: 27630536 Free PMC article.
-
Tripping the light fantastic in membrane redox biology: linking dynamic structures to function in ER electron transfer chains.FEBS J. 2019 Jun;286(11):2004-2017. doi: 10.1111/febs.14757. Epub 2019 Jan 30. FEBS J. 2019. PMID: 30657259 Free PMC article. Review.
References
-
- Leys D, Basran J, Talfournier F, Sutcliffe MJ, Scrutton NS. Nat. Struct. Biol. 2003;10:219. - PubMed
-
- Toogood HS, Thiel AV, Basran J, Sutcliffe MJ, Scrutton NS, Leys D. J. Biol. Chem. 2004;279:32904. - PubMed
-
- Leys D, Scrutton NS. Curr. Opin. Struct. Biol. 2004;14:642. - PubMed
-
- Thorpe C. In: Chemistry and Biochemistry of Flavoenzymes. Müller F, editor. II. London: CRC Press Inc.; 1991. p. 471.
-
- Jones M, Basran J, Sutcliffe MJ, Gunter Grossmann J, Scrutton NS. J. Biol. Chem. 2000;275:21349. - PubMed
Grants and funding
- BB/D01963X/1/BB_/Biotechnology and Biological Sciences Research Council/United Kingdom
- BB/F004397/1/BB_/Biotechnology and Biological Sciences Research Council/United Kingdom
- BBS/B/03572/BB_/Biotechnology and Biological Sciences Research Council/United Kingdom
- BBS/B/03572/2/BB_/Biotechnology and Biological Sciences Research Council/United Kingdom
LinkOut - more resources
Full Text Sources
