. 2009 Jun;8(6):2733-9.
doi: 10.1021/pr801028b.

Expediting the development of targeted SRM assays: using data from shotgun proteomics to automate method development

Affiliations

Expediting the development of targeted SRM assays: using data from shotgun proteomics to automate method development

Amol Prakash et al. J Proteome Res. 2009 Jun.

Abstract

Selected reaction monitoring (SRM) is a powerful tandem mass spectrometry method that can be used to monitor target peptides within a complex protein digest. The specificity and sensitivity of the approach, as well as its capability to multiplex the measurement of many analytes in parallel, has made it a technology of particular promise for hypothesis driven proteomics. An underappreciated step in the development of an assay to measure many peptides in parallel is the time and effort necessary to establish a usable assay. Here we report the use of shotgun proteomics data to expedite the selection of SRM transitions for target peptides of interest. The use of tandem mass spectrometry data acquired on an LTQ ion trap mass spectrometer can accurately predict which fragment ions will produce the greatest signal in an SRM assay using a triple quadrupole mass spectrometer. Furthermore, we present a scoring routine that can compare the targeted SRM chromatogram data with an MS/MS spectrum acquired by data-dependent acquisition and stored in a library. This scoring routine is invaluable in determining which signal in the chromatogram from a complex mixture best represents the target peptide. These algorithmic developments have been implemented in a software package that is available from the authors upon request.


Figures

Figure 1
Figure 1
LTQ-CID spectrum of the doubly charge peptide at m/z 762 from the peptide ASGAFTGENSVDQIK from the S. cerevisiae protein triose phosphate isomerase. The green stars represent the TSQ-CID product ion relative abundance for the same peptide measured by selected reaction monitoring.
Figure 2
Figure 2
Effect of using an LTQ spectrum library in directing the selection of product ions. A. Plot of the ratio of the library transitions area/heuristic transitions area calculated for 129 C. elegans peptides. The mean ratio is 1.90 and the median is 1.20. Thus, most peptides show an increase in signal intensity when transitions were chosen using the LTQ spectrum library. The library-based SRM transition selection showed a greater area calculation for 75.6% of the peptides and no change for 8.7%. B. The fraction of summed signal from the n most intense transitions that are accounted for by the respective method of selecting the product ions. A score of 100% means that the selected transitions were the n most intense transitions monitored. Heuristic 1 is implemented exactly as described in the methods and begins choosing y-ions at m/z > the precursor m/z; whereas, Heuristic 2 and Heuristic 3 began at the first and second y-ion below the precursor m/z respectively.
Figure 2
Figure 2
Effect of using an LTQ spectrum library in directing the selection of product ions. A. Plot of the ratio of the library transitions area/heuristic transitions area calculated for 129 C. elegans peptides. The mean ratio is 1.90 and the median is 1.20. Thus, most peptides show an increase in signal intensity when transitions were chosen using the LTQ spectrum library. The library-based SRM transition selection showed a greater area calculation for 75.6% of the peptides and no change for 8.7%. B. The fraction of summed signal from the n most intense transitions that are accounted for by the respective method of selecting the product ions. A score of 100% means that the selected transitions were the n most intense transitions monitored. Heuristic 1 is implemented exactly as described in the methods and begins choosing y-ions at m/z > the precursor m/z; whereas, Heuristic 2 and Heuristic 3 began at the first and second y-ion below the precursor m/z respectively.
Figure 3
Figure 3
Plot of the distribution of the Costa-Soares score and the p-value for varying number of transitions.
Figure 4
Figure 4
Effect of the number of SRM transitions on the match between the SRM data and the LTQ library spectrum. As the number of transitions increases, the likelihood that the Costa-Soares score could have been derived by random chance decreases.
Figure 5
Figure 5
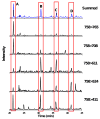
TSQ-SRM chromatogram for the individual transitions 758>411, 524, 611, 708 and 765, corresponding to the formation of the y-ions y3, y4, y5, y6 and y7, respectively. There are four different retention times where there are multiple precursor > product ion transition pairs at a single retention time, complicating the unambiguous determination of which retention time is representative of the target peptide.
Figure 6
Figure 6
Comparison of the product ion intensities from the LTQ-CID spectrum (black bars) compared to each of the four targeted retention times: 21.2 (red), 30.7, 36 and 41.2. The Costa-Soares score (CS), p-value (PV), and Bonferroni corrected p-value (BPV) are listed to provide a measure of similarity between the SRM transition intensities and the LTQ library spectrum.

References

    1. Arnott D, Kishiyama A, Luis EA, Ludlum SG, Marsters JC, Jr, Stults JT. Mol Cell Proteomics. 2002;1:148–56. - PubMed
    1. Chang EJ, Archambault V, McLachlin DT, Krutchinsky AN, Chait BT. Anal Chem. 2004;76:4472–83. - PubMed
    1. Jin M, Bateup H, Padovan JC, Greengard P, Nairn AC, Chait BT. Anal Chem. 2005;77:7845–51. - PubMed
    1. Barnidge DR, Goodmanson MK, Klee GG, Muddiman DC. J Proteome Res. 2004;3:644–52. - PubMed
    1. Anderson L, Hunter CL. Mol Cell Proteomics. 2006;5:573–88. - PubMed

Publication types