

MRM screening/biomarker discovery with linear ion trap MS: a library of human cancer-specific peptides
- PMID: 19327145
- PMCID: PMC2670839
- DOI: 10.1186/1471-2407-9-96
MRM screening/biomarker discovery with linear ion trap MS: a library of human cancer-specific peptides
Abstract
Background: The discovery of novel protein biomarkers is essential in the clinical setting to enable early disease diagnosis and increase survivability rates. To facilitate differential expression analysis and biomarker discovery, a variety of tandem mass spectrometry (MS/MS)-based protein profiling techniques have been developed. For achieving sensitive detection and accurate quantitation, targeted MS screening approaches, such as multiple reaction monitoring (MRM), have been implemented.
Methods: MCF-7 breast cancer protein cellular extracts were analyzed by 2D-strong cation exchange (SCX)/reversed phase liquid chromatography (RPLC) separations interfaced to linear ion trap MS detection. MS data were interpreted with the Sequest-based Bioworks software (Thermo Electron). In-house developed Perl-scripts were used to calculate the spectral counts and the representative fragment ions for each peptide.
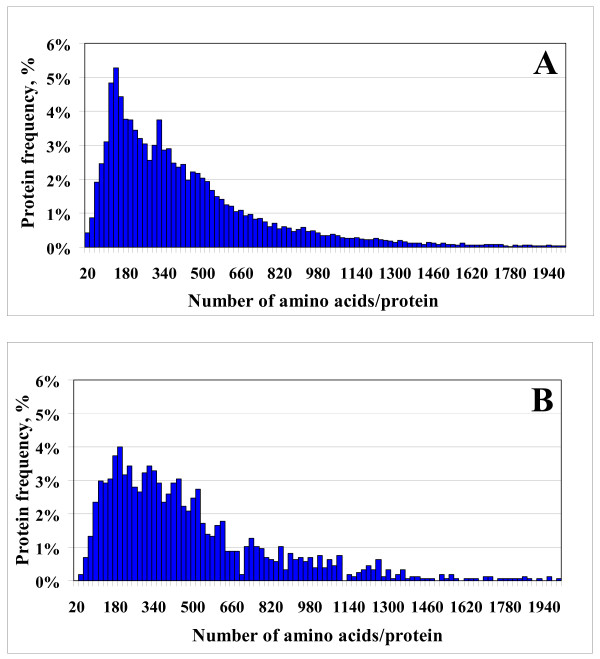
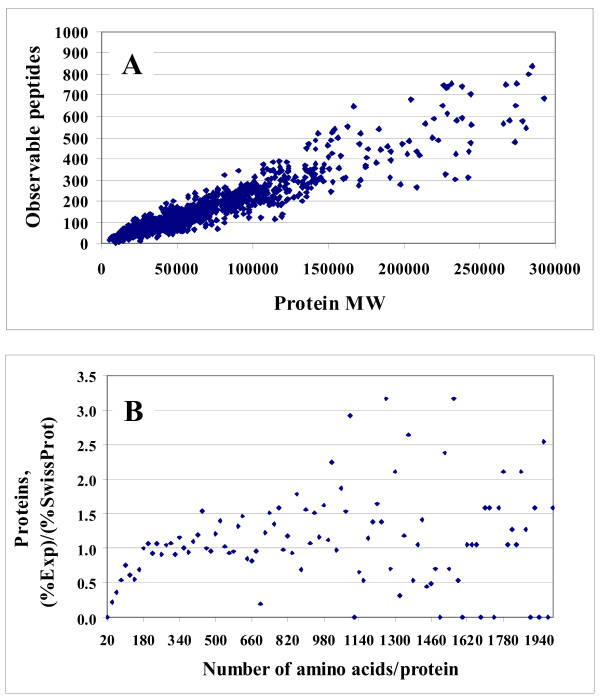
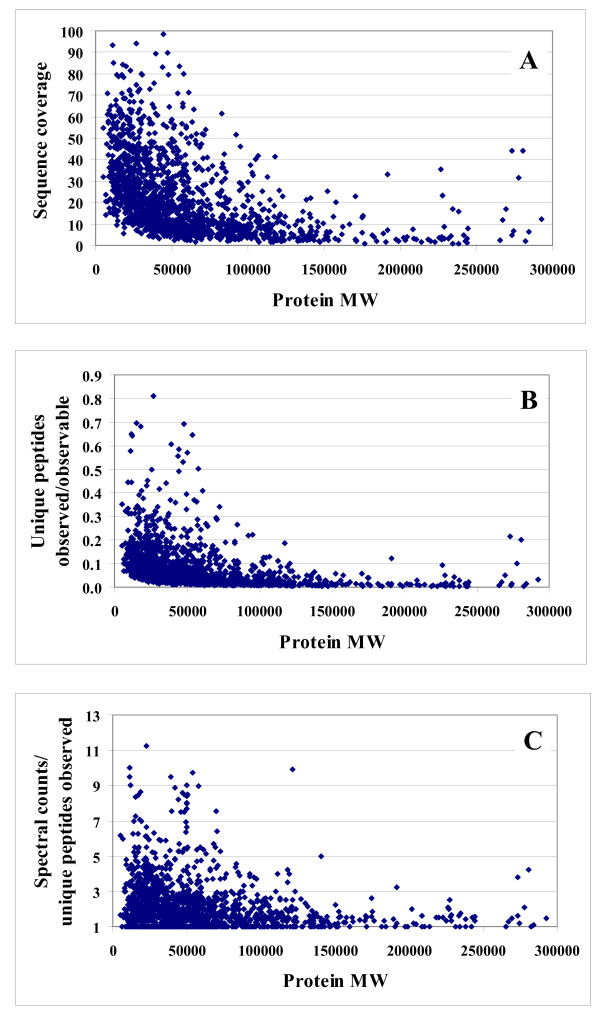
Results: In this work, we report on the generation of a library of 9,677 peptides (p < 0.001), representing approximately 1,572 proteins from human breast cancer cells, that can be used for MRM/MS-based biomarker screening studies. For each protein, the library provides the number and sequence of detectable peptides, the charge state, the spectral count, the molecular weight, the parameters that characterize the quality of the tandem mass spectrum (p-value, DeltaM, Xcorr, DeltaCn, Sp, no. of matching a, b, y ions in the spectrum), the retention time, and the top 10 most intense product ions that correspond to a given peptide. Only proteins identified by at least two spectral counts are listed. The experimental distribution of protein frequencies, as a function of molecular weight, closely matched the theoretical distribution of proteins in the human proteome, as provided in the SwissProt database. The amino acid sequence coverage of the identified proteins ranged from 0.04% to 98.3%. The highest-abundance proteins in the cellular extract had a molecular weight (MW)<50,000.
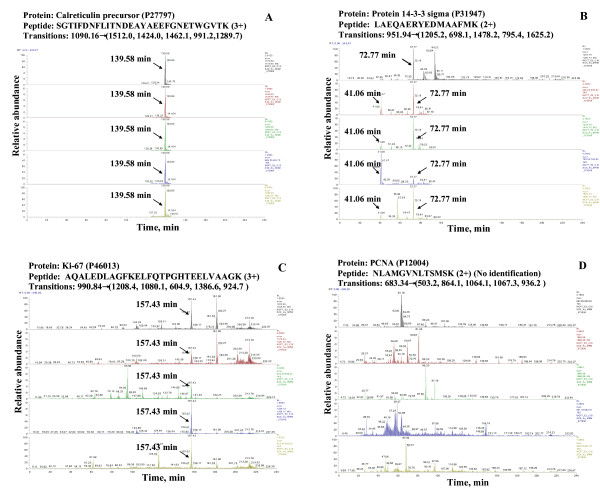
Conclusion: Preliminary experiments have demonstrated that putative biomarkers, that are not detectable by conventional data dependent MS acquisition methods in complex un-fractionated samples, can be reliable identified with the information provided in this library. Based on the spectral count, the quality of a tandem mass spectrum and the m/z values for a parent peptide and its most abundant daughter ions, MRM conditions can be selected to enable the detection of target peptides and proteins.
Figures
Similar articles
-
Fast proteomic protocol for biomarker fingerprinting in cancerous cells.J Chromatogr A. 2010 Apr 23;1217(17):2862-70. doi: 10.1016/j.chroma.2010.02.065. Epub 2010 Mar 3. J Chromatogr A. 2010. PMID: 20307887 Free PMC article.
-
Enhanced peptide quantification using spectral count clustering and cluster abundance.BMC Bioinformatics. 2011 Oct 28;12:423. doi: 10.1186/1471-2105-12-423. BMC Bioinformatics. 2011. PMID: 22034872 Free PMC article.
-
Off-line two-dimensional liquid chromatography with maximized sample loading to reversed-phase liquid chromatography-electrospray ionization tandem mass spectrometry for shotgun proteome analysis.Anal Chem. 2009 Feb 1;81(3):1049-60. doi: 10.1021/ac802106z. Anal Chem. 2009. PMID: 19178338
-
Protocol for Standardizing High-to-Moderate Abundance Protein Biomarker Assessments Through an MRM-with-Standard-Peptides Quantitative Approach.Adv Exp Med Biol. 2016;919:515-530. doi: 10.1007/978-3-319-41448-5_24. Adv Exp Med Biol. 2016. PMID: 27975233 Review.
-
[Recent advances in glycopeptide enrichment and mass spectrometry data interpretation approaches for glycoproteomics analyses].Se Pu. 2021 Oct;39(10):1045-1054. doi: 10.3724/SP.J.1123.2021.06011. Se Pu. 2021. PMID: 34505426 Free PMC article. Review. Chinese.
Cited by
-
Dynamic and Combinatorial Landscape of Histone Modifications during the Intraerythrocytic Developmental Cycle of the Malaria Parasite.J Proteome Res. 2016 Aug 5;15(8):2787-801. doi: 10.1021/acs.jproteome.6b00366. Epub 2016 Jun 24. J Proteome Res. 2016. PMID: 27291344 Free PMC article.
-
Network-based pipeline for analyzing MS data: an application toward liver cancer.J Proteome Res. 2011 May 6;10(5):2261-72. doi: 10.1021/pr1010845. Epub 2011 Mar 28. J Proteome Res. 2011. PMID: 21410269 Free PMC article.
-
Proteomic study reveals a functional network of cancer markers in the G1-Stage of the breast cancer cell cycle.BMC Cancer. 2014 Sep 24;14:710. doi: 10.1186/1471-2407-14-710. BMC Cancer. 2014. PMID: 25252636 Free PMC article.
-
CPTAC Assay Portal: a repository of targeted proteomic assays.Nat Methods. 2014 Jul;11(7):703-4. doi: 10.1038/nmeth.3002. Nat Methods. 2014. PMID: 24972168 Free PMC article. No abstract available.
-
Using the CPTAC Assay Portal to Identify and Implement Highly Characterized Targeted Proteomics Assays.Methods Mol Biol. 2016;1410:223-36. doi: 10.1007/978-1-4939-3524-6_13. Methods Mol Biol. 2016. PMID: 26867747 Free PMC article.
References
-
- Ackermann BL, Hale JE, Duffin KL. The role of mass spectrometry in biomarker discovery and measurement. Curr Drug Metab. 2006;7:525–539. - PubMed
-
- Veenstra TD, Conrads TP, Hood BL, Avellino AM, Ellenbogen RG, Morrison RS. Biomarkers: mining the biofluid proteome. Mol Cell Proteomics. 2005;4:409–418. - PubMed
-
- Powell DW, Merchant ML, Link AJ. Discovery of regulatory molecular events and biomarkers using 2D capillary chromatography and mass spectrometry. Expert Rev Proteomics. 2006;3:63–74. - PubMed
-
- Kussmann M, Raymond F, Affolter M. OMICS-driven biomarker discovery in nutrition and health. J Biotechnol. 2006;124:758–787. - PubMed
-
- Gygi SP, Rist B, Gerber SA, Turecek F, Gelb MH, Aebersold R. Quantitative analysis of complex protein mixtures using isotope-coded affinity tags. Nat Biotechnol. 1999;17:994–999. - PubMed
Publication types
MeSH terms
Substances
Grants and funding
LinkOut - more resources
Full Text Sources
Other Literature Sources
Medical
Molecular Biology Databases
