. 2009;10(3):R32.
doi: 10.1186/gb-2009-10-3-r32. Epub 2009 Mar 27.

Evaluation of next generation sequencing platforms for population targeted sequencing studies

Affiliations

Evaluation of next generation sequencing platforms for population targeted sequencing studies

Olivier Harismendy et al. Genome Biol. 2009.

Abstract

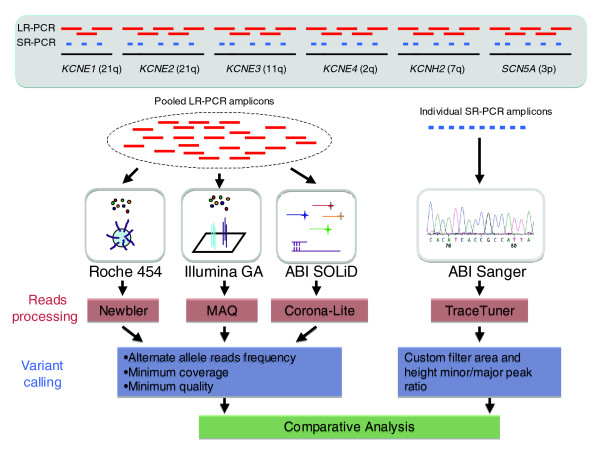
Background: Next generation sequencing (NGS) platforms are currently being utilized for targeted sequencing of candidate genes or genomic intervals to perform sequence-based association studies. To evaluate these platforms for this application, we analyzed human sequence generated by the Roche 454, Illumina GA, and the ABI SOLiD technologies for the same 260 kb in four individuals.

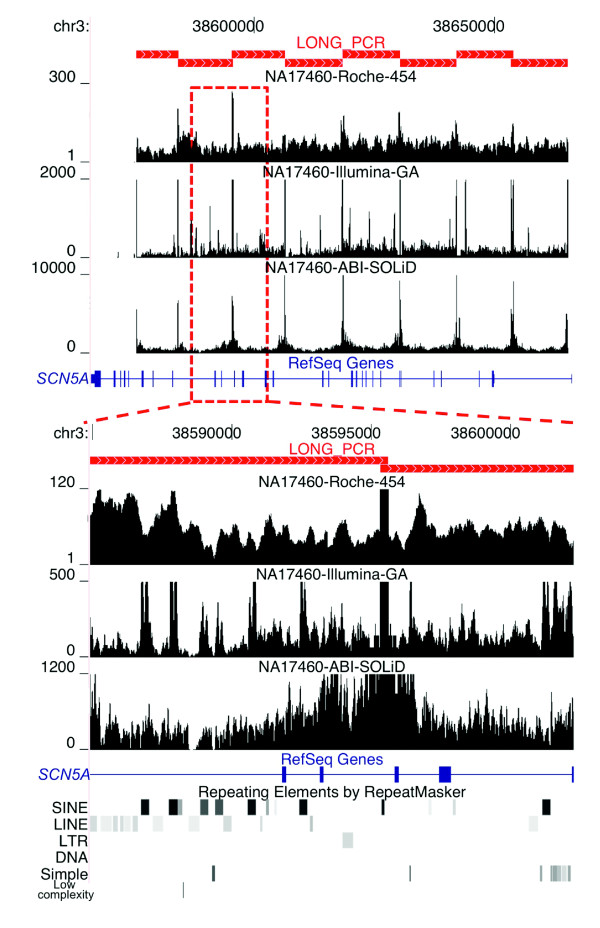
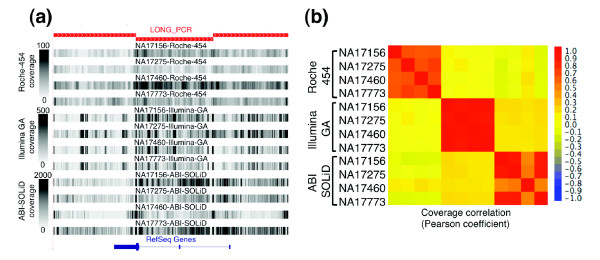
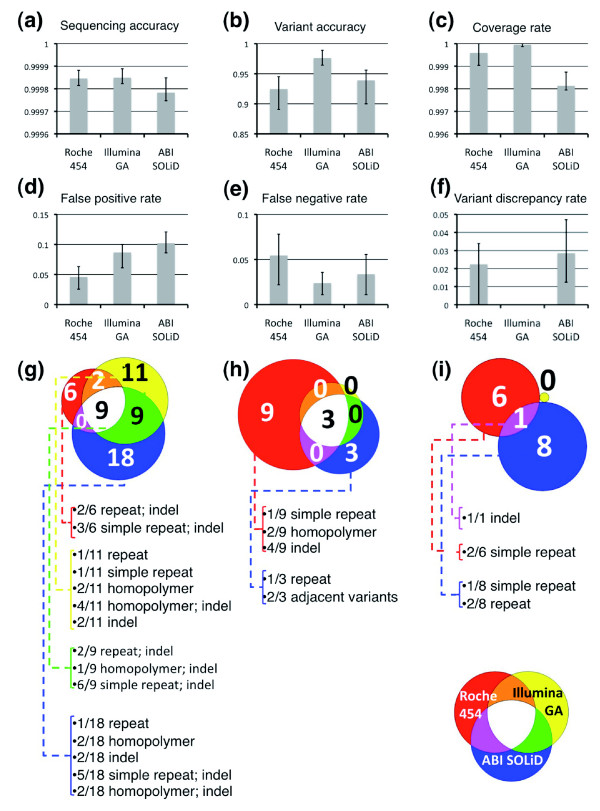
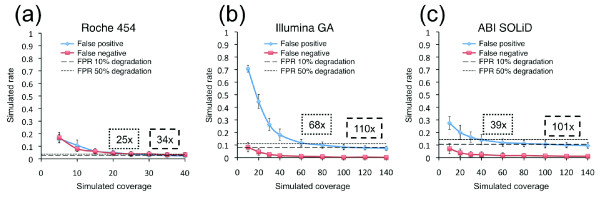
Results: Local sequence characteristics contribute to systematic variability in sequence coverage (>100-fold difference in per-base coverage), resulting in patterns for each NGS technology that are highly correlated between samples. A comparison of the base calls to 88 kb of overlapping ABI 3730xL Sanger sequence generated for the same samples showed that the NGS platforms all have high sensitivity, identifying >95% of variant sites. At high coverage, depth base calling errors are systematic, resulting from local sequence contexts; as the coverage is lowered additional 'random sampling' errors in base calling occur.

Conclusions: Our study provides important insights into systematic biases and data variability that need to be considered when utilizing NGS platforms for population targeted sequencing studies.


Figures

Figure 1
Figure 1
Overview of experimental design. Six genomic intervals, each encoding genes for K+/Na+ voltage-gated channel proteins, were amplified using DNA from four individuals and LR-PCR reactions to generate 260 kb of target sequence per sample. Amplicons from each individual were pooled in equimolar amounts and then sequenced using the three NGS platforms. The 260 kb examined in this study is representative of human sequences containing 38% repeats and 4% coding sequence compared with 47% and 1%, respectively, genome-wide. For each sample 88 kb was amplified using short range PCR (SR-PCR) reactions targeting the exons and evolutionarily conserved intronic regions. Each SR-PCR amplicon was individually sequenced in the forward and reverse directions using the ABI-3730xL platform (Additional data file 2). Data generated from the NGS platforms were analyzed to identify bases variants from the reference sequence (build 36) and the quality of the variant calls was assessed using platform specific methodologies. A comparative analysis of the sequence data from the NGS platforms and ABI Sanger was then performed to determine accuracy, and false positive and false negative rates.
Figure 2
Figure 2
Non-uniform per-base sequence coverage. The 100-kb interval on chromosome 3 encoding the SCN5A gene (blue rectangles and joining lines) was amplified using eight LR-PCR amplicons (red filled rectangles in upper panel). On the y-axis, the fold sequence coverage scale is shown for each platform. The upper panel shows that amplicon end sequences are highly overrepresented. The y-axis was set to show the relative fold coverage of the sequences in the interval and therefore does not accurately represent the maximum fold coverage of the amplicon ends, which was 311, 195,473, and 15,041 for Roche 454, Illumina GA, and ABI SOLiD, respectively, in the sample shown. The lower panel shows the non-uniformity of sequence coverage across an approximately 17-kb region encompassing four exons of SCN5A. The locations of the repetitive elements (lower black/gray rectangles) in the interval are shown.
Figure 3
Figure 3
Each NGS technology generates a consistent pattern of non-uniform sequence coverage. (a) Sequence coverage depth is displayed as a gray-scale (0-100× for Roche 454; 0-500× for Illumina GA and ABI SOLiD) along an approximately 25-kb region of chromosome 11 amplified by three long-range PCR products (red rectangles). (b) A heat-map colored matrix displays the coefficient of correlation of coverage across the entire 260 kb of analyzed sequence between each of the 72 possible pair-wise comparisons (four samples by three technologies). The apparent lower correlation of the Roche-454 sequence coverage is more reflective of the smaller amplitude in the coverage variability (lower average coefficient of variance) than a lack of coverage correlation from sample to sample. The correlation of NA17460 with the other three samples on the ABI SOLiD platform is slightly lower due to technological issues (Additional data file 2) and was therefore excluded from the coefficient of correlation calculation reported in the text.
Figure 4
Figure 4
Performance metrics of NGS technologies. (a-f) Error bars represent minimum and maximum values obtained from the four samples. (g-i) Venn diagram representation of false positive calls (g), false negative calls (h) and discrepant variants calls (i). The inset caption displays the color-coding of each NGS technology and overlaps: for Roche 454 (red), Illumina GA (yellow) and ABI SOLiD (blue). For each NGS platform the number of base calls with errors associated with specific sequence contexts is given (repeat = repetitive element). When two sequence contexts are present they are both listed.
Figure 5
Figure 5
False positive rates (FPRs) and false negative rates for the three NGS technologies at simulated varying coverage depths. Performances of (a) Roche 454, (b) Illumina GA, and (c) ABI SOLiD at lower coverage depths were simulated by random subsampling of the reads. Error bars represent the standard deviation over the four samples for ten iterations. The thresholds for a 10% and 50% error rate degradation of the minimum false positive rate are indicated by dashed and dotted lines, respectively, and the corresponding coverage depth reported in dashed and dotted boxes, respectively.

References

    1. Sanger F, Nicklen S, Coulson AR. DNA sequencing with chain-terminating inhibitors. Proc Natl Acad Sci USA. 1977;74:5463–5467. doi: 10.1073/pnas.74.12.5463. - DOI - PMC - PubMed
    1. Bonetta L. Genome sequencing in the fast lane. Nat Methods. 2006;3:141–147. doi: 10.1038/nmeth0206-141. - DOI
    1. von Bubnoff A. Next-generation sequencing: the race is on. Cell. 2008;132:721–723. doi: 10.1016/j.cell.2008.02.028. - DOI - PubMed
    1. Schuster SC. Next-generation sequencing transforms today's biology. Nat Methods. 2008;5:16–18. doi: 10.1038/nmeth1156. - DOI - PubMed
    1. Johnson DS, Mortazavi A, Myers RM, Wold B. Genome-wide mapping of in vivo protein-DNA interactions. Science. 2007;316:1497–1502. doi: 10.1126/science.1141319. - DOI - PubMed

Publication types