

Changes in sodium pump expression dictate the effects of ouabain on cell growth
- PMID: 19329430
- PMCID: PMC2685674
- DOI: 10.1074/jbc.M808355200
Changes in sodium pump expression dictate the effects of ouabain on cell growth
Abstract
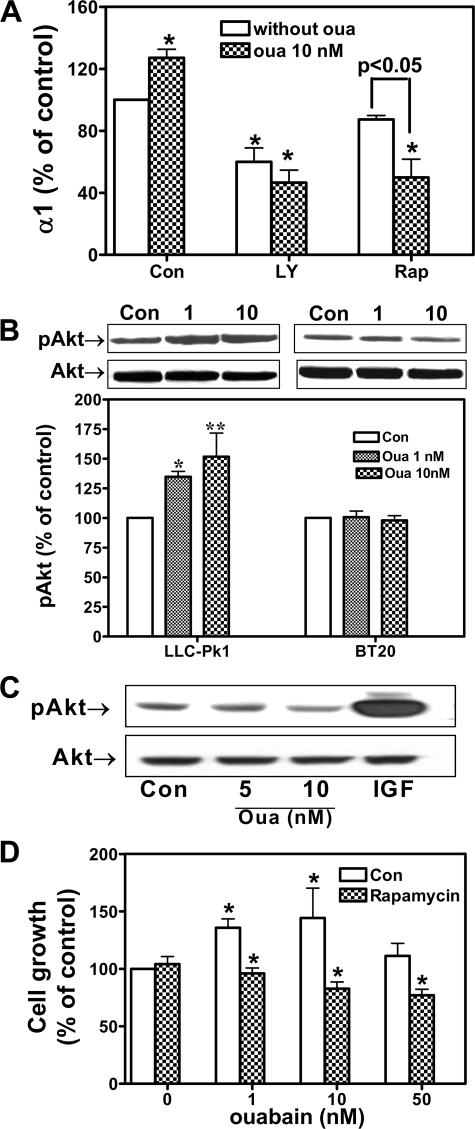
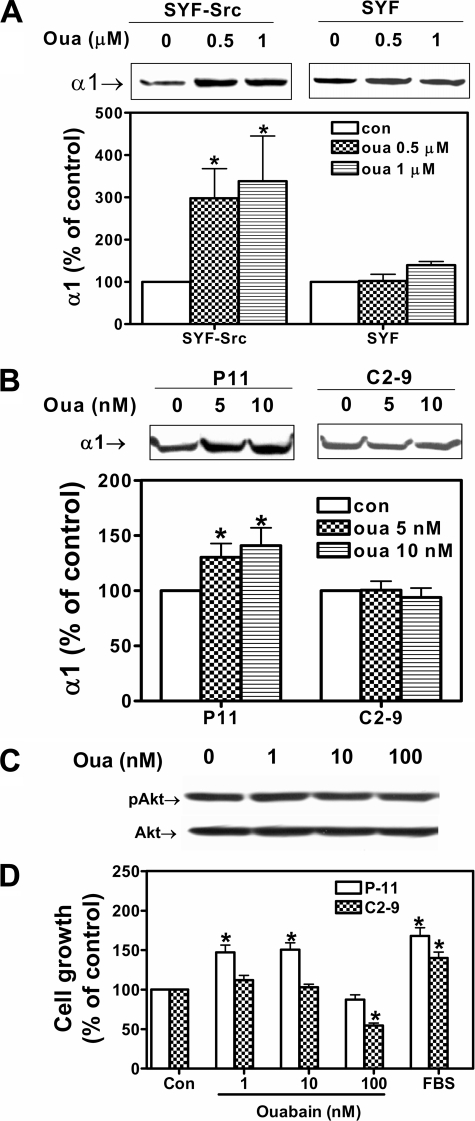
Here we show that ouabain-induced cell growth regulation is intrinsically coupled to changes in the cellular amount of Na/K-ATPase via the phosphoinositide 3-kinase (PI3K)/Akt/mammalian target of rapamycin (mTOR) pathway. Ouabain increases the endocytosis and degradation of Na/K-ATPase in LLC-PK1, human breast (BT20), and prostate (DU145) cancer cells. However, ouabain stimulates the PI3K/Akt/mTOR pathway and consequently up-regulates the expression of Na/K-ATPase in LLC-PK1 but not BT20 and DU145 cells. This up-regulation is sufficient to replete the plasma membrane pool of Na/K-ATPase and to stimulate cell proliferation in LLC-PK1 cells. On the other hand, ouabain causes a gradual depletion of Na/K-ATPase and an increased expression of cell cycle inhibitor p21(cip), which consequently inhibits cell proliferation in BT20 and DU145 cells. Consistently, we observe that small interfering RNA-mediated knockdown of Na/K-ATPase is sufficient to induce the expression of p21(cip) and slow the proliferation of LLC-PK1 cells. Moreover, this knockdown converts the growth stimulatory effect of ouabain to growth inhibition in LLC-PK1 cells. Mechanistically, both Src and caveolin-1 are required for ouabain-induced activation of Akt and up-regulation of Na/K-ATPase. Furthermore, inhibition of the PI3K/Akt/mTOR pathway by rapamycin completely blocks ouabain-induced expression of Na/K-ATPase and converts ouabain-induced growth stimulation to growth inhibition in LLC-PK1 cells. Taken together, we conclude that changes in the expression of Na/K-ATPase dictate the growth regulatory effects of ouabain on cells.
Figures


Similar articles
-
Ouabain-induced endocytosis of the plasmalemmal Na/K-ATPase in LLC-PK1 cells requires caveolin-1.Kidney Int. 2005 May;67(5):1844-54. doi: 10.1111/j.1523-1755.2005.00283.x. Kidney Int. 2005. PMID: 15840032
-
Ouabain induces endocytosis of plasmalemmal Na/K-ATPase in LLC-PK1 cells by a clathrin-dependent mechanism.Kidney Int. 2004 Jul;66(1):227-41. doi: 10.1111/j.1523-1755.2004.00723.x. Kidney Int. 2004. PMID: 15200429
-
Association of PI3K-Akt signaling pathway with digitalis-induced hypertrophy of cardiac myocytes.Am J Physiol Cell Physiol. 2007 Nov;293(5):C1489-97. doi: 10.1152/ajpcell.00158.2007. Epub 2007 Aug 29. Am J Physiol Cell Physiol. 2007. PMID: 17728397
-
Ouabain-induced endocytosis and signal transduction of the Na/K-ATPase.Front Biosci. 2005 Sep 1;10:2056-63. doi: 10.2741/1681. Front Biosci. 2005. PMID: 15970478 Review.
-
Molecular mechanisms of Na/K-ATPase-mediated signal transduction.Ann N Y Acad Sci. 2003 Apr;986:497-503. doi: 10.1111/j.1749-6632.2003.tb07234.x. Ann N Y Acad Sci. 2003. PMID: 12763870 Review.
Cited by
-
Modulation of Na(+)-K(+)-ATPase cell surface abundance through structural determinants on the α1-subunit.Am J Physiol Cell Physiol. 2011 Jan;300(1):C42-8. doi: 10.1152/ajpcell.00386.2010. Epub 2010 Nov 3. Am J Physiol Cell Physiol. 2011. PMID: 21048163 Free PMC article.
-
Somatic mutations of the ATP1A1 gene and aldosterone-producing adenomas.Mol Cell Endocrinol. 2015 Jun 15;408:213-9. doi: 10.1016/j.mce.2014.12.004. Epub 2014 Dec 10. Mol Cell Endocrinol. 2015. PMID: 25496839 Free PMC article. Review.
-
Heterogeneity of signal transduction by Na-K-ATPase α-isoforms: role of Src interaction.Am J Physiol Cell Physiol. 2018 Feb 1;314(2):C202-C210. doi: 10.1152/ajpcell.00124.2017. Epub 2017 Nov 8. Am J Physiol Cell Physiol. 2018. PMID: 29118027 Free PMC article.
-
Na,K-ATPase Acts as a Beta-Amyloid Receptor Triggering Src Kinase Activation.Cells. 2022 Sep 3;11(17):2753. doi: 10.3390/cells11172753. Cells. 2022. PMID: 36078160 Free PMC article.
-
Digoxin use and risk of invasive breast cancer: evidence from the Nurses' Health Study and meta-analysis.Breast Cancer Res Treat. 2014 Apr;144(2):427-35. doi: 10.1007/s10549-014-2886-x. Epub 2014 Feb 28. Breast Cancer Res Treat. 2014. PMID: 24573543 Free PMC article.
References
-
- Skou, J. C. (1965) Physiol. Rev. 45 596-617 - PubMed
-
- Lingrel, J. B., Orlowski, J., Shull, M. M., and Price, E. M. (1990) Prog. Nucleic Acids Res. Mol. Biol. 38 37-89 - PubMed
-
- Li, Z., and Xie, Z. (2009) Pfluegers Arch. Eur. J. Physiol. 457 635-644 - PubMed
-
- Liang, M., Cai, T., Tian, J., Qu, W., and Xie, Z. J. (2006) J. Biol. Chem. 281 19709-19719 - PubMed
Publication types
MeSH terms
Substances
Grants and funding
LinkOut - more resources
Full Text Sources
Other Literature Sources
Miscellaneous
