Structural and biophysical characterization of the proteins interacting with the herpes simplex virus 1 origin of replication
- PMID: 19329432
- PMCID: PMC2713556
- DOI: 10.1074/jbc.M806134200
Structural and biophysical characterization of the proteins interacting with the herpes simplex virus 1 origin of replication
Abstract
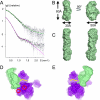
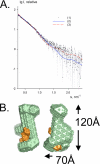
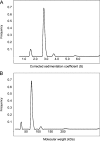
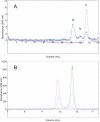
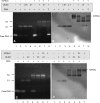
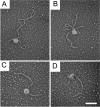
The C terminus of the herpes simplex virus type 1 origin-binding protein, UL9ct, interacts directly with the viral single-stranded DNA-binding protein ICP8. We show that a 60-amino acid C-terminal deletion mutant of ICP8 (ICP8DeltaC) also binds very strongly to UL9ct. Using small angle x-ray scattering, the low resolution solution structures of UL9ct alone, in complex with ICP8DeltaC, and in complex with a 15-mer double-stranded DNA containing Box I of the origin of replication are described. Size exclusion chromatography, analytical ultracentrifugation, and electrophoretic mobility shift assays, backed up by isothermal titration calorimetry measurements, are used to show that the stoichiometry of the UL9ct-dsDNA15-mer complex is 2:1 at micromolar protein concentrations. The reaction occurs in two steps with initial binding of UL9ct to DNA (Kd approximately 6 nM) followed by a second binding event (Kd approximately 0.8 nM). It is also shown that the stoichiometry of the ternary UL9ct-ICP8DeltaC-dsDNA15-mer complex is 2:1:1, at the concentrations used in the different assays. Electron microscopy indicates that the complex assembled on the extended origin, oriS, rather than Box I alone, is much larger. The results are consistent with a simple model whereby a conformational switch of the UL9 DNA-binding domain upon binding to Box I allows the recruitment of a UL9-ICP8 complex by interaction between the UL9 DNA-binding domains.
Figures

Similar articles
-
Complex of the herpes simplex virus type 1 origin binding protein UL9 with DNA as a platform for the design of a new type of antiviral drugs.J Biomol Struct Dyn. 2014;32(9):1456-73. doi: 10.1080/07391102.2013.820110. Epub 2013 Jul 24. J Biomol Struct Dyn. 2014. PMID: 23879454 Free PMC article.
-
A truncated herpes simplex virus origin binding protein which contains the carboxyl terminal origin binding domain binds to the origin of replication but does not alter its conformation.Nucleic Acids Res. 1993 Nov 11;21(22):5203-11. doi: 10.1093/nar/21.22.5203. Nucleic Acids Res. 1993. PMID: 8255778 Free PMC article.
-
[Complex of the herpes simplex virus initiator protein UL9 with DNA as a platform for the design of a new type of antiviral drugs].Biofizika. 2010 Mar-Apr;55(2):239-51. Biofizika. 2010. PMID: 20429277 Russian.
-
Association of origin binding protein and single strand DNA-binding protein, ICP8, during herpes simplex virus type 1 DNA replication in vivo.J Biol Chem. 1994 Nov 18;269(46):29329-34. J Biol Chem. 1994. PMID: 7961904
-
A comprehensive review of methods to study lncRNA-protein interactions in solution.Biochem Soc Trans. 2022 Oct 31;50(5):1415-1426. doi: 10.1042/BST20220604. Biochem Soc Trans. 2022. PMID: 36250427 Review.
Cited by
-
Herpes simplex viruses: mechanisms of DNA replication.Cold Spring Harb Perspect Biol. 2012 Sep 1;4(9):a013011. doi: 10.1101/cshperspect.a013011. Cold Spring Harb Perspect Biol. 2012. PMID: 22952399 Free PMC article. Review.
-
Complex of the herpes simplex virus type 1 origin binding protein UL9 with DNA as a platform for the design of a new type of antiviral drugs.J Biomol Struct Dyn. 2014;32(9):1456-73. doi: 10.1080/07391102.2013.820110. Epub 2013 Jul 24. J Biomol Struct Dyn. 2014. PMID: 23879454 Free PMC article.
-
Physical basis of the inducer-dependent cooperativity of the Central glycolytic genes Repressor/DNA complex.Nucleic Acids Res. 2010 Sep;38(17):5944-57. doi: 10.1093/nar/gkq334. Epub 2010 May 12. Nucleic Acids Res. 2010. PMID: 20462860 Free PMC article.
-
Herpes simplex virus 1 ICP8 mutant lacking annealing activity is deficient for viral DNA replication.Proc Natl Acad Sci U S A. 2019 Jan 15;116(3):1033-1042. doi: 10.1073/pnas.1817642116. Epub 2018 Dec 31. Proc Natl Acad Sci U S A. 2019. PMID: 30598436 Free PMC article.
-
Replication and recombination of herpes simplex virus DNA.J Biol Chem. 2011 May 6;286(18):15619-24. doi: 10.1074/jbc.R111.233981. Epub 2011 Mar 1. J Biol Chem. 2011. PMID: 21362621 Free PMC article. Review.
References
Publication types
MeSH terms
Substances
Grants and funding
LinkOut - more resources
Full Text Sources
Miscellaneous

