. 2009 Mar;21(3):954-71.
doi: 10.1105/tpc.108.063164. Epub 2009 Mar 27.

Methyl salicylate production and jasmonate signaling are not essential for systemic acquired resistance in Arabidopsis

Affiliations

Methyl salicylate production and jasmonate signaling are not essential for systemic acquired resistance in Arabidopsis

Elham Attaran et al. Plant Cell. 2009 Mar.

Abstract

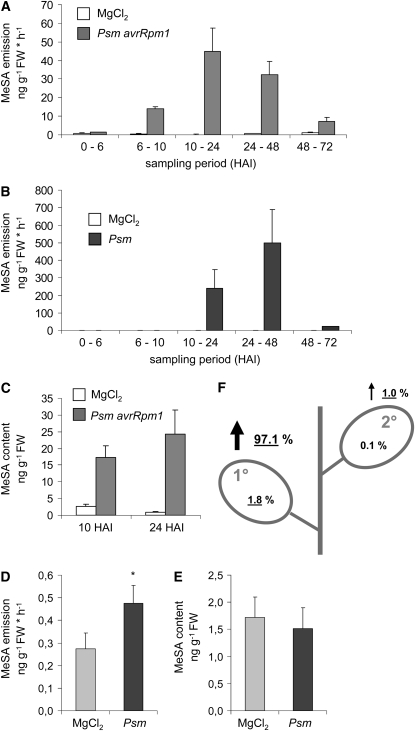
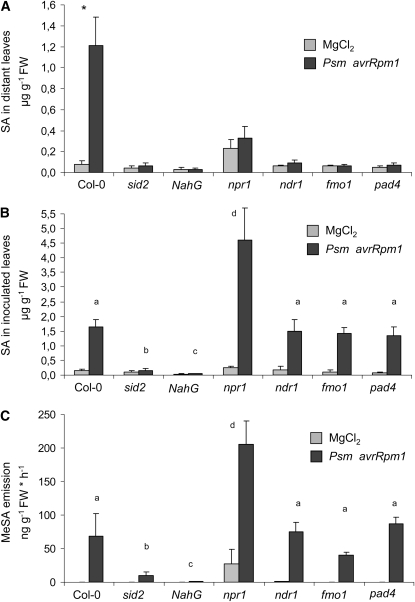
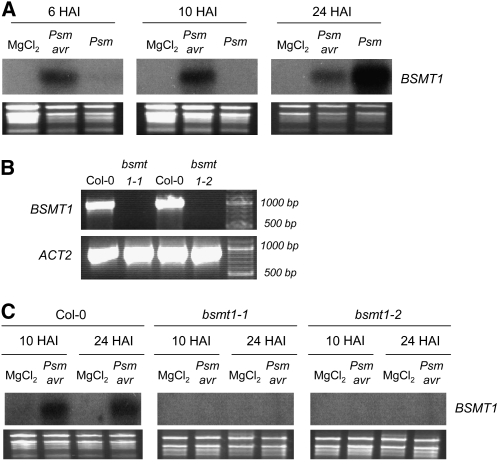
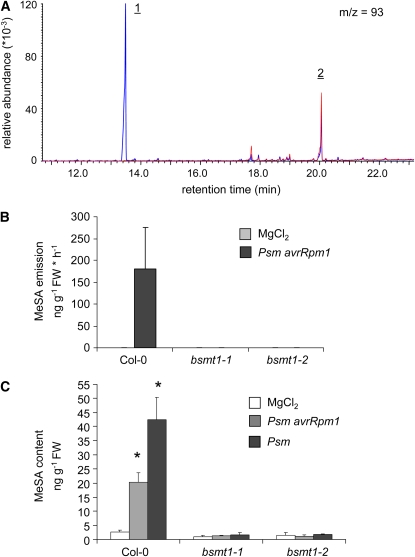
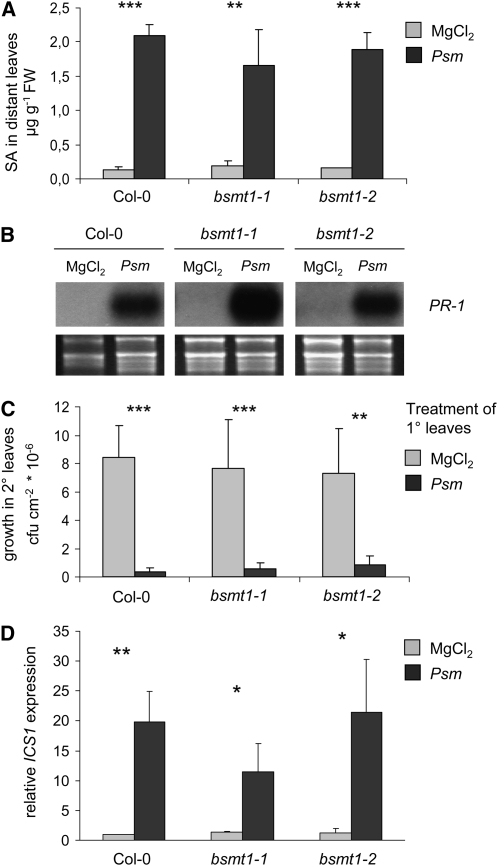
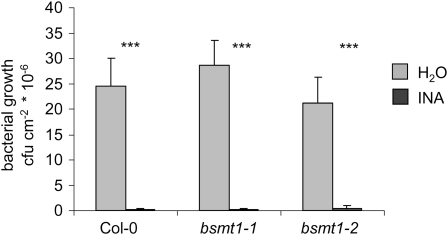
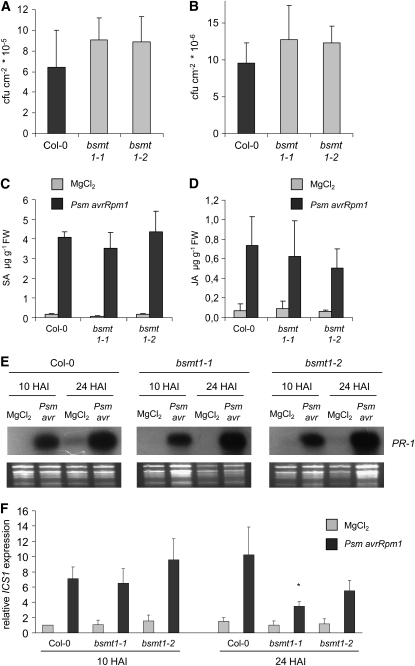
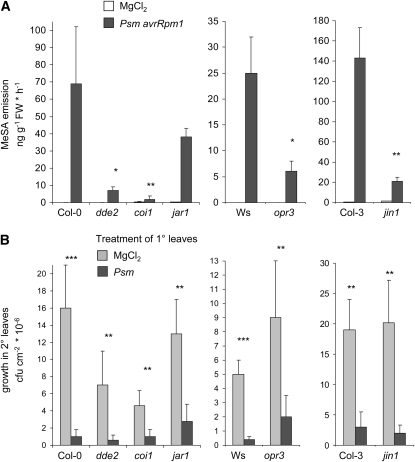
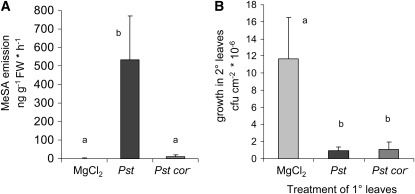
Systemic acquired resistance (SAR) develops in response to local microbial leaf inoculation and renders the whole plant more resistant to subsequent pathogen infection. Accumulation of salicylic acid (SA) in noninfected plant parts is required for SAR, and methyl salicylate (MeSA) and jasmonate (JA) are proposed to have critical roles during SAR long-distance signaling from inoculated to distant leaves. Here, we address the significance of MeSA and JA during SAR development in Arabidopsis thaliana. MeSA production increases in leaves inoculated with the SAR-inducing bacterial pathogen Pseudomonas syringae; however, most MeSA is emitted into the atmosphere, and only small amounts are retained. We show that in several Arabidopsis defense mutants, the abilities to produce MeSA and to establish SAR do not coincide. T-DNA insertion lines defective in expression of a pathogen-responsive SA methyltransferase gene are completely devoid of induced MeSA production but increase systemic SA levels and develop SAR upon local P. syringae inoculation. Therefore, MeSA is dispensable for SAR in Arabidopsis, and SA accumulation in distant leaves appears to occur by de novo synthesis via isochorismate synthase. We show that MeSA production induced by P. syringae depends on the JA pathway but that JA biosynthesis or downstream signaling is not required for SAR. In compatible interactions, MeSA production depends on the P. syringae virulence factor coronatine, suggesting that the phytopathogen uses coronatine-mediated volatilization of MeSA from leaves to attenuate the SA-based defense pathway.


Figures

Figure 1.
Figure 1.
Leaf MeSA Production in Arabidopsis Col-0 Plants upon P. syringae Inoculation. (A) and (B) Time course of MeSA emission after inoculation with HR-inducing Psm avrRpm1 (gray bars) (A), inoculation with compatible Psm (black bars) (B), or infiltration with 10 mM MgCl2 (white bars). Mean values of ng emitted substance g−1 leaf FW h−1sd) from three independent plants are given. The time periods during which volatiles were collected are indicated. HAI, h after inoculation. (C) Leaf MeSA contents in response to inoculation with Psm avrRpm1 (gray bars) or infiltration with 10 mM MgCl2 (white bars) at 10 and 24 HAI (means ± sd, n = 3). (D) Emission of MeSA from nontreated, distant leaves of Psm-inoculated or MgCl2-infiltrated Col-0 plants. Treated leaves were removed at the onset of SAR (at 2 DAI), and emission of the remainder of the plant was sampled from 2 to 3 DAI. Mean values of ng emitted MeSA g−1 leaf FW h−1sd, n = 5) are given. Asterisk denotes statistically significant differences between Psm and MgCl2 treatments (P < 0.05). (E) MeSA content in nontreated, distant leaves of Psm-inoculated or MgCl2-infiltrated Col-0 plants at 2 DAI (means ± sd, n = 5). (F) Fate of MeSA after its production during SAR in a symbolized Col-0 plant. Percentages of total MeSA produced after a localized P. syringae inoculation are indicated. An underlined value indicates a significant increase after pathogen treatment. 1°, inoculated leaf; 2°, noninoculated, systemic leaf. Numbers given next to vertical arrows represent emission; numbers inside leaves represent leaf content.
Figure 2.
Figure 2.
SA Accumulation and MeSA Production in P. syringae–Treated Wild-Type and SAR-Defective Mutant Plants. (A) SA levels in nontreated, distant leaves of Psm avrRpm1–inoculated or MgCl2-infiltrated plants at 2 DAI (means ± sd, n = 4). Asterisk denotes statistically significant differences between Psm avrRpm1- and MgCl2-treated plants (P < 0.01). (B) SA levels in Psm avrRpm1–inoculated leaves at 24 HAI (means ± sd, n = 4). Different characters symbolize statistically significant differences between Psm avrRpm1–treated plants from distinct lines (P < 0.05). (C) MeSA emission from Psm avrRpm1- or mock-inoculated plants from 0 to 24 HAI (means ± sd, n = 4). Different characters symbolize statistically significant differences between Psm avrRpm1–treated plants from distinct lines (P < 0.05).
Figure 3.
Figure 3.
P. syringae–Induced Leaf Expression of the BSMT1 Methyl Transferase Gene and Identification of Nonexpressing T-DNA Insertion Lines. (A) Expression of BSMT1 in Col-0 leaves inoculated with Psm avrRpm1 (Psm avr) or Psm. Control samples were infiltrated with 10 mM MgCl2. Leaf samples were taken at 6, 10, and 24 HAI for RNA gel blot analysis. (B) PCR analyses using genomic DNA from Col-0, bsmt1-1 (SALK_140496), and bsmt1-2 (WiscDSLox430E05) mutant plants as templates and primers specific for the BSMT1 gene sequence. The actin gene ACT2 was amplified as a control. (C) Expression patterns of BSMT1 in Col-0 and bsmt1 leaves infiltrated with 10 mM MgCl2 or Psm avrRpm1 (Psm avr) as assessed by gel blot analysis. Leaf samples were taken at 10 and 24 HAI.
Figure 4.
Figure 4.
bsmt1 Mutant Plants Are Completely Devoid of P. syringae–Induced MeSA Production. (A) Ion chromatogram at m/z 93 of volatile samples from Col-0 plants (blue) and bsmt1-1 plants (red), illustrating MeSA (1) and TMTT (2) emission. (B) Quantification of MeSA emitted from wild-type Col-0 and bsmt1 mutant plants inoculated with Psm avrRpm1 or infiltrated with MgCl2. Volatiles were collected from 0 to 24 HAI. Bars represent mean emission values (±sd, n = 4). MeSA emission was not detected in either bsmt1 mutant line (detection limit ∼0.05 ng g−1 FW h−1). (C) Leaf MeSA contents of Col-0 and bsmt1 mutant plants in response to inoculation with Psm avrRpm1 (gray bars), Psm (black bars), or infiltration with 10 mM MgCl2 (white bars) at 24 HAI (means ± sd, n = 3). Asterisks denote statistically significant differences between P. syringae- and MgCl2-treated plants of a particular line (P < 0.003).
Figure 5.
Figure 5.
P. syringae Induces SAR in bsmt1 Mutant Plants. (A) Accumulation of SA in untreated, upper (2°) leaves after Psm inoculation, or MgCl2 infiltration of lower (1°) leaves. Treatments of 1° leaves were performed as described in (C). 2° leaves were harvested 2 d later for analyses. Bars represent mean values (±sd) of three independent samples, each sample consisting of six leaves from two different plants. Asterisks denote statistically significant differences in systemic SA levels between Psm and MgCl2 pretreated plants of a particular line (***P < 0.001; **P < 0.01). (B) Expression of the SAR marker gene PR-1 in untreated, upper (2°) leaves after Psm inoculation or MgCl2 infiltration of lower (1°) leaves, as assessed by gel blot analyses. 2° leaves were harvested 2 d after the 1° treatment for analyses. (C) Bacterial growth quantification to directly assess enhancement of systemic resistance. Plants were pretreated with either 10 mM MgCl2 or Psm (OD = 0.01) in three lower (1°) leaves. Two days later, three upper leaves (2°) were challenge infected with Psm (OD = 0.002). Bacterial growth in upper leaves was assessed 3 d after the 2° leaf inoculation. Bars represent mean values (±sd) of colony-forming units (cfu) per square centimeter from at least seven parallel samples each consisting of three leaf disks. Asterisks denote statistically significant differences of bacterial growth in 2° leaves between Psm and MgCl2 pretreated plants of a particular line (***P < 0.001; **P < 0.01). (D) Relative expression levels of ICS1, as assessed by quantitative real-time PCR analysis. ICS1 expression values were normalized to those for the reference gene (At1g62930) and expressed relative to the wild-type MgCl2 sample. For each expression value of one sample, three PCR replicates were performed and averaged. The depicted bars represent mean values (±sd) of three biologically independent samples. Asterisks denote statistically significant differences in systemic SA levels between Psm and MgCl2 pretreated plants of a particular line (**P < 0.01; *P < 0.05).
Figure 6.
Figure 6.
INA-Induced Resistance in Col-0 and bsmt1 Mutant Plants. Plants were sprayed with 0.65 mM INA or water, and three leaves per plant infected 2 d later with Psm (OD = 0.002). Bacterial growth was assessed 3 d after inoculation (***P < 0.001).
Figure 7.
Figure 7.
Local Defense Responses in bsmt1 Plants Are Similar to Those in the Wild Type. (A) and (B) Bacterial growth quantification of Psm avrRpm1 (OD = 0.005) (A) and Psm (OD = 0.002) (B) in leaves of wild-type and bsmt1 mutant plants 3 DAI. Bars represent means (±sd) of cfu per cm2 from at least six parallel samples from different plants, each sample consisting of three leaf disks. No significant differences in bacterial numbers were detected at 3 DAI and 1 HAI (data not shown) for samples from different lines. (C) and (D) Accumulation of the defense hormones SA (C) and JA (D) at sites of Psm avrRpm1 inoculation (10 HAI). Control samples were infiltrated with 10 mM MgCl2. (E) RNA gel blot analysis of PR-1 expression in Col-0 and bsmt1 leaves infiltrated with 10 mM MgCl2 or Psm avrRpm1 (Psm avr). Leaf samples were taken at 10 and 24 HAI. (F) Relative ICS1 expression in Col-0 and bsmt1 leaves infiltrated with 10 mM MgCl2 or Psm avrRpm1, as assessed by quantitative real-time PCR analyses (see Figure 5D for details). Leaf samples were taken at 10 and 24 HAI. Asterisk indicates statistically significant differences between Psm avrRpm1–treated wild-type and mutant samples (P < 0.05).
Figure 8.
Figure 8.
MeSA Production but Not SAR Is Regulated by JA Signaling. (A) Leaf MeSA emission from Psm avrRpm1- or mock-inoculated JA pathway mutants and their corresponding wild-type lines (dde2, coi1, and jar1 are in Col-0, opr3 is in Ws, and jin1 is in Col-3 background). Volatiles were sampled from 0 to 24 HAI, and mean values (±sd, n = 4) are given. Asterisks indicate whether statistically significant differences exist between Psm avrRpm1–treated JA mutant plants and the corresponding wild type (**P < 0.01; *P < 0.05). Note the different scales of the y axes. (B) SAR assessment via bacterial growth quantification in challenge-infected upper (2°) leaves of pretreated (1°) JA pathway mutants and respective wild-type plants. For experimental details, see legend to Figure 5C. Bars represent means (±sd) of cfu per cm2 from at least seven parallel samples. Asterisks denote statistically significant differences of bacterial growth in 2° leaves between Psm and MgCl2 pretreated plants of a particular line (***P < 0.001; **P < 0.01). No statistically significant differences (P > 0.05) exist between Psm-treated wild-type and mutant samples with respect to a particular background, indicating a similar strength of SAR induction for the different lines. Note the different scales of the y axes.
Figure 9.
Figure 9.
P. syringae–Induced MeSA Formation but Not SAR Is Dependent on Bacterial Production of the Phytotoxin Coronatine. (A) MeSA emission from Col-0 leaves after inoculation with coronatine-producing Pst, coronatine-deficient Pst cor, and MgCl2 infiltration. Volatiles were sampled from 0 to 24 HAI, and mean values of ng emitted substance g−1 leaf FW h−1sd, n = 7) are given. Different letters symbolize statistically significant differences between treatments (P < 0.002). (B) SAR induction by Pst and Pst cor in Col-0 plants. 1° leaves were infiltrated with MgCl2, Pst, or Pst cor (OD 0.01 each), 2° leaves were challenge-infected 2 d later with Psm (OD 0.002), and quantities of Psm in 2° leaves were determined another 3 d later (see Figure 5C for details). Bars represent means (±sd) of cfu per cm2 from at least six parallel samples. Different characters symbolize statistically significant differences between treatments (P < 0.01).

References

    1. Alonso, J.M., et al. (2003). Genome-wide insertional mutagenesis of Arabidopsis thaliana. Science 301 653–657. - PubMed
    1. Ament, K., Van Schie, C.C., Bouwmeester, H.J., Haring, M.A., and Schuurink, R.C. (2006). Induction of a leaf specific geranylgeranyl pyrophosphate synthase and emission of (E,E)-4,8,12-trimethyltrideca-1,3,7,11-tetraene in tomato are dependent on both jasmonic acid and salicylic acid signaling pathways. Planta 224 1197–1208. - PubMed
    1. Arimura, G.I., Garms, S., Maffei, M., Bossi, S., Schulze, B., Leitner, M., Mithoefer, A., and Boland, W. (2008). Herbivore-induced terpenoid emission in Medicago truncatula: Concerted action of jasmonate, ethylene and calcium signaling. Planta 227 453–464. - PMC - PubMed
    1. Attaran, E., Rostás, M., and Zeier, J. (2008). Pseudomonas syringae elicits emission of the terpenoid (E,E)-4,8,12-trimethyl-1,3,7,11-tridecatetraene in Arabidopsis leaves via jasmonate signaling and expression of the terpene synthase TPS4. Mol. Plant Microbe Interact. 21 1482–1497. - PubMed
    1. Bender, C.L., Alarcon-Chaidez, F., and Gross, D.C. (1999). Pseudomonas syringae phytotoxins: Mode of action, regulation and biosynthesis by peptide and polyketide synthetases. Microbiol. Mol. Biol. Rev. 63 266–292. - PMC - PubMed

Publication types

MeSH terms