. 2009 May;150(1):55-72.
doi: 10.1104/pp.109.137737. Epub 2009 Mar 27.

Analysis of acyl fluxes through multiple pathways of triacylglycerol synthesis in developing soybean embryos

Affiliations

Analysis of acyl fluxes through multiple pathways of triacylglycerol synthesis in developing soybean embryos

Philip D Bates et al. Plant Physiol. 2009 May.

Abstract

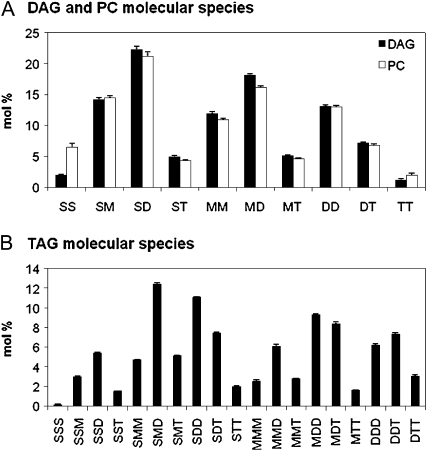
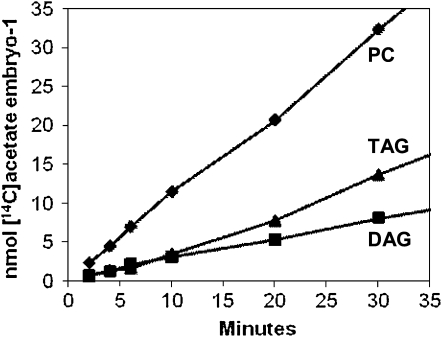
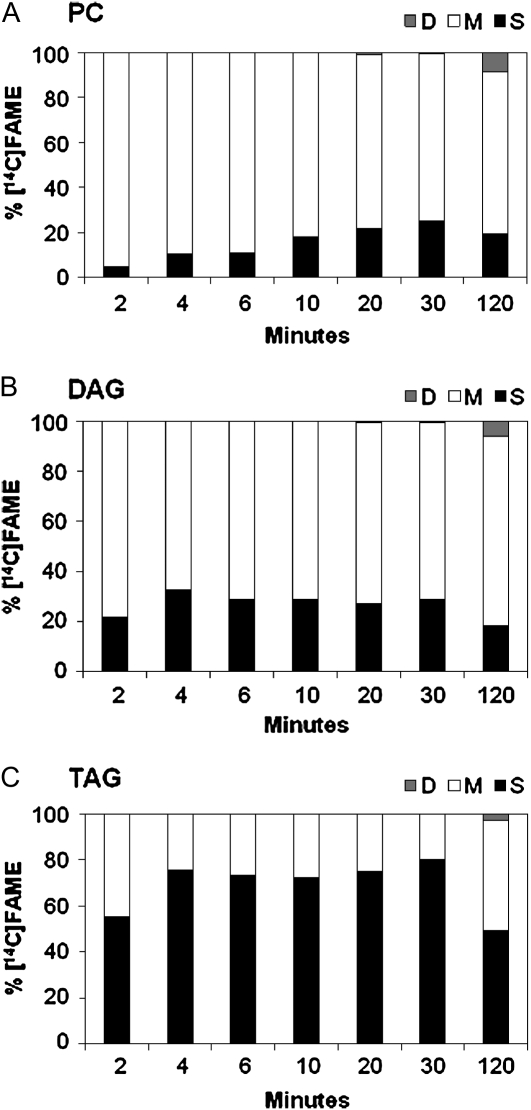
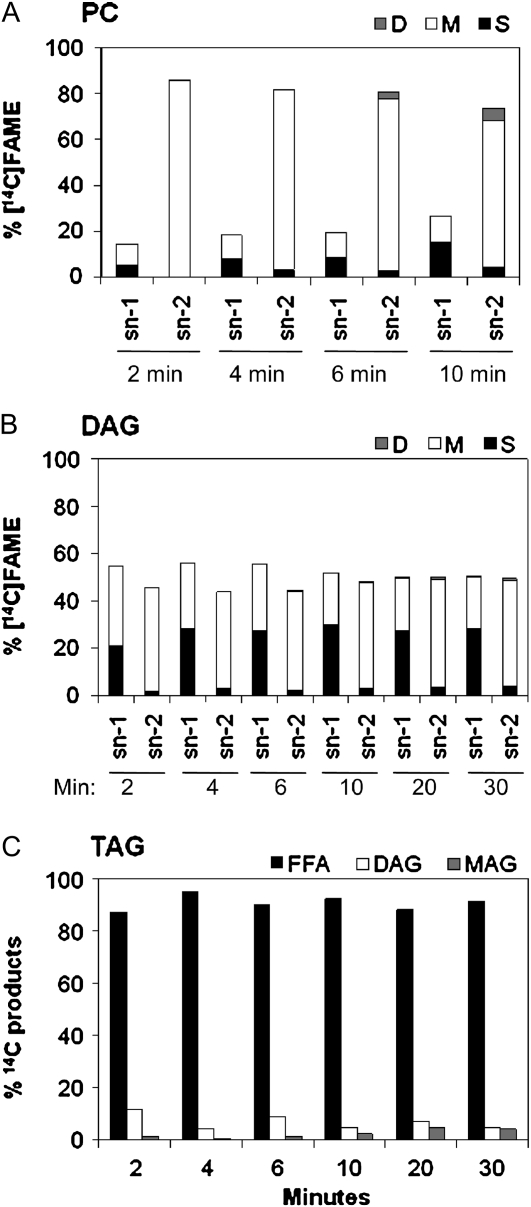
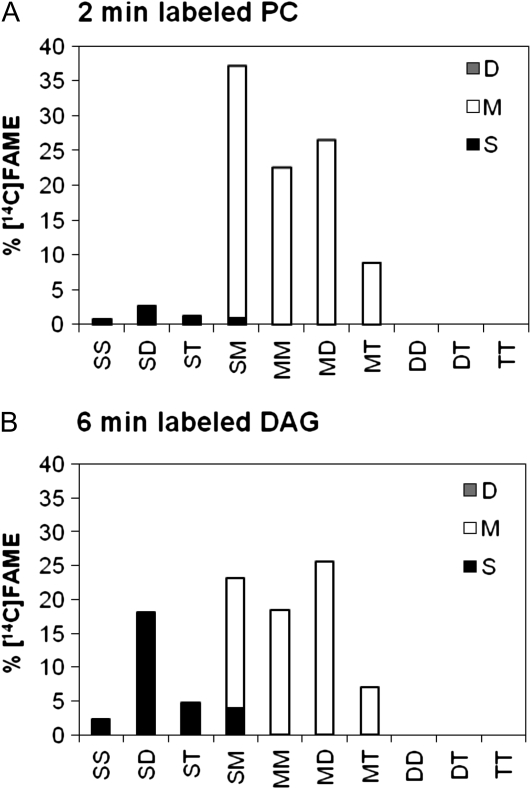
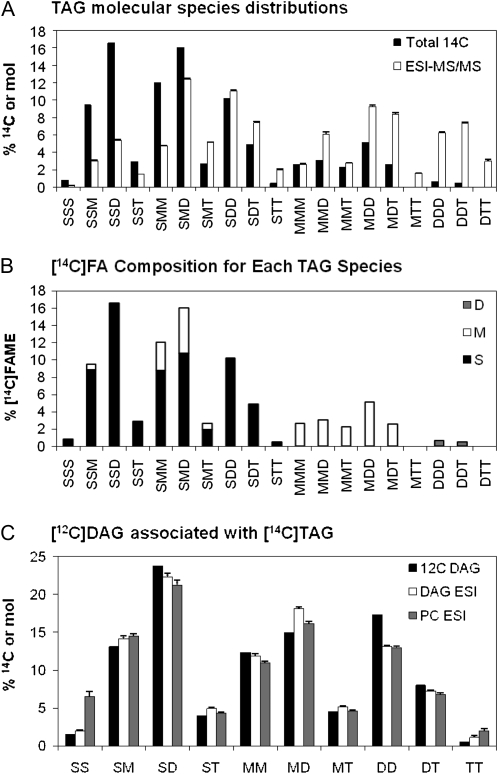
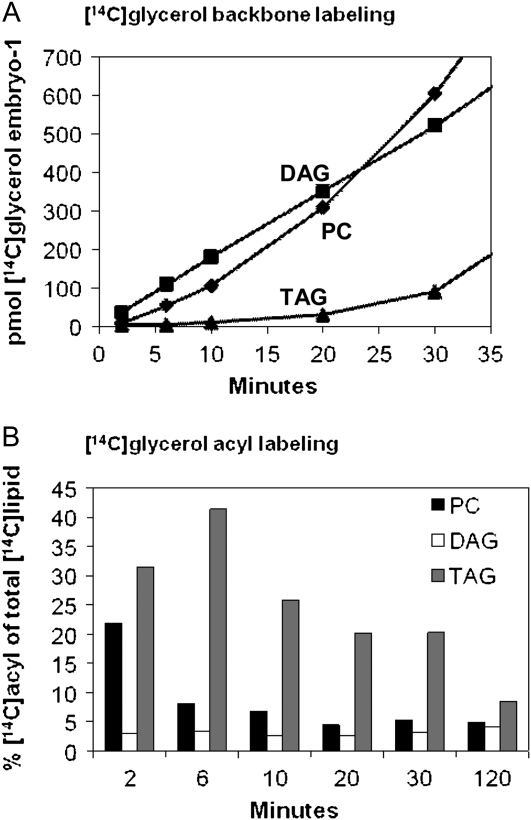
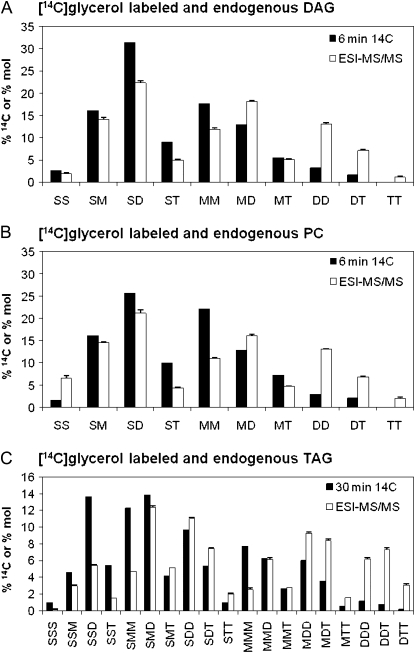
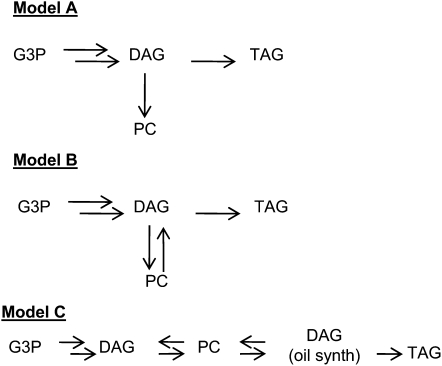
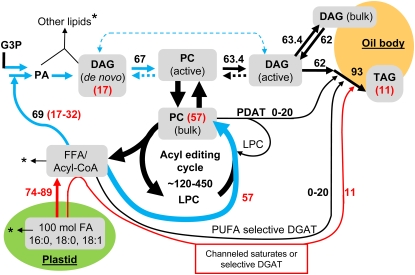
The reactions leading to triacylglycerol (TAG) synthesis in oilseeds have been well characterized. However, quantitative analyses of acyl group and glycerol backbone fluxes that comprise extraplastidic phospholipid and TAG synthesis, including acyl editing and phosphatidylcholine-diacylglycerol interconversion, are lacking. To investigate these fluxes, we rapidly labeled developing soybean (Glycine max) embryos with [(14)C]acetate and [(14)C]glycerol. Cultured intact embryos that mimic in planta growth were used. The initial kinetics of newly synthesized acyl chain and glycerol backbone incorporation into phosphatidylcholine (PC), 1,2-sn-diacylglycerol (DAG), and TAG were analyzed along with their initial labeled molecular species and positional distributions. Almost 60% of the newly synthesized fatty acids first enter glycerolipids through PC acyl editing, largely at the sn-2 position. This flux, mostly of oleate, was over three times the flux of nascent [(14)C]fatty acids incorporated into the sn-1 and sn-2 positions of DAG through glycerol-3-phosphate acylation. Furthermore, the total flux for PC acyl editing, which includes both nascent and preexisting fatty acids, was estimated to be 1.5 to 5 times the flux of fatty acid synthesis. Thus, recycled acyl groups (16:0, 18:1, 18:2, and 18:3) in the acyl-coenzyme A pool provide most of the acyl chains for de novo glycerol-3-phosphate acylation. Our results also show kinetically distinct DAG pools. DAG used for TAG synthesis is mostly derived from PC, whereas de novo synthesized DAG is mostly used for PC synthesis. In addition, two kinetically distinct sn-3 acylations of DAG were observed, providing TAG molecular species enriched in saturated or polyunsaturated fatty acids.


Figures

Figure 1.
Figure 1.
Endogenous molecular species compositions of DAG, PC, and TAG from developing soybean embryos of 13 to 14 mg dry weight per embryo precultured for 3 d, as determined by ESI-MS/MS. Molecular species are represented as two or three FAs (no stereochemistry specified). Bar heights represent mol % of each species among the total. For comparison to radiolabeled molecular species separated by argentation TLC as shown in later figures, the molecular species here are grouped based on the individual FA number of double bonds: total saturates (16:0, 18:0, 20:0, etc.), S; monoenes (18:1), M; dienes (18:2), D; and trienes (18:3), T. Full molecular species measurements of the nongrouped lipid molecular species for TAG, DAG, and PC are in Supplemental Tables S1 and S2, respectively. A, DAG (black bars) and PC (white bars). B, TAG.
Figure 2.
Figure 2.
Time course for [14C]acetate incorporation into the acyl groups of the major labeled soybean embryo lipids. Results expressed as nmoles of [14C]acetate incorporated per embryo for each lipid. Data shown are from one representative labeling experiment. A second [14C]acetate labeling experiment demonstrated similar kinetic relationships between PC, DAG, and TAG. Diamonds, PC; triangles, TAG; squares, DAG.
Figure 3.
Figure 3.
Radiolabeled FA composition of [14C]acetate-labeled lipids presented in Figure 2. Each bar shows the distribution of radioactivity among different acyl groups at each time point. Bar shading: total saturates, S, black; monoenes (18:1), M, white; and dienes (18:2), D, gray. A, PC; B, DAG; C, TAG.
Figure 4.
Figure 4.
Positional analysis of [14C]acetate-labeled acyl groups in different lipids. Major labeled lipids from the [14C]acetate labeling time course were subject to lipase positional analysis. Bar heights represent percentage of lipid label in that position. A and B, Bar shading represents the labeled FA as a percentage of the whole lipid: total saturates, S, black; monoenes, M, (18:1), white; and dienes, D, (18:2), gray. A, PC. B, DAG. C, TAG. Bar shading: FFA (sn-1 or sn-3), black; DAG (sn-1,2 DAG or sn-2,3 DAG), white; MAG (sn-2), gray.
Figure 5.
Figure 5.
Molecular species compositions of [14C]acetate-labeled PC and DAG. Molecular species were separated by argentation TLC. Nomenclature is as described in Figure 1. Bar height represents percentage of each species among total labeled species. Bar shading represents the amount of each radiolabeled FA in each species. Bar shading: S, total saturates, black bars; M, monoenes (18:1), white bars; and D, dienes (18:2), gray bars. Molecular species of labeled lipids were determined for the earliest time points that had enough radioactivity for the analysis. A, Two minute labeled PC; B, 6 min labeled DAG. Data for later time points are in given in Supplemental Figures S3 and S4.
Figure 6.
Figure 6.
Analysis of TAG molecular species separated by argentation TLC after 6 min of labeling of soybean embryos with [14C]acetate. Molecular species nomenclature as given in Figure 1. A, [14C]Acetate-labeled molecular species (black bars) and endogenous molecular species from Figure 1 (white bars). B, Labeled FA composition within each molecular species of [14C]acetate-labeled TAG. Bar shading represents the labeled FA within each molecular species: saturates, S, black; monoenes (18:1), M, white; dienes (18:2), D, gray; and trienes, T. C, Calculated unlabeled DAG molecular species associated with labeled TAG in B, assuming one sn-3-labeled FA per molecular species (black bars). Endogenous molecular species from Figure 1: DAG (white bars) and PC (gray bars).
Figure 7.
Figure 7.
Time course for the incorporation of [14C]glycerol into the backbone and acyl groups of the major labeled soybean embryo lipids. [14C]Glycerol labeled lipids were transmethylated so that glycerol labeling and acyl labeling could be quantified separately. A, Kinetics of [14C]glycerol backbone moiety labeling. Results expressed as pmoles [14C]glycerol incorporated embryo−1. B, Percentage of total lipid [14C]glycerol labeling that is in the acyl chains over the time course. Bar shading: PC, black bars; DAG, white bars; and TAG, gray bars.
Figure 8.
Figure 8.
Molecular species composition of [14C]glycerol backbone-labeled PC, DAG, and TAG. Molecular species are as defined in Figure 1. [14C]Glycerol-labeled molecular species represent backbone labeling only (acyl chain labeling has been subtracted; black bars). Molecular species were determined at the earliest time point with enough radioactivity for analysis. The endogenous molecular species compositions are from Figure 1 (white bars). A, Six minute labeled DAG; B, 6 min labeled PC; C, 30 min labeled TAG. Additional 10- and 30-min time points for molecular species of DAG and PC are shown in Supplemental Figure S6.
Figure 9.
Figure 9.
Representative flux models for TAG synthesis. A more extensive set of models that were tested by pool filling simulations of kinetic labeling experiments is shown in Supplemental Figure S9.
Figure 10.
Figure 10.
Soybean TAG synthesis acyl flux model. The assumptions and flux calculations are presented online. The model follows 100 mol of newly synthesized FA in the plastid through the major fluxes of lipid metabolism such that the final accumulations of FAs are TAG, 93 mol; PC, 3.6 mol; DAG, 1.4 mol; and other lipids, 2 mol. Other membrane lipids in soybean embryos are mostly PE and PI. The arrows indicate the fluxes, with the major metabolite pools proposed from kinetic analysis highlighted in gray. Dashed arrows represent uncertainty for that reaction. The black numbers represent total net steady-state fluxes or flux ranges as calculated online. The arrows highlighted in blue and red represent the major initial fluxes of newly synthesized FA as measured by [14C]acetate labeling. Blue arrows represent fluxes where nascent and endogenous acyl groups mix, while red arrows indicate only nascent FA. The red numbers represent the initial accumulation of nascent FA into the major labeled glycerolipids PC, DAG, and TAG, which together accumulate approximately 85% of initial FA. Approximately 15% of nascent FA initially accumulates in lipids other than PC, DAG, and TAG. The asterisks represent small fluxes of acyl groups to these other lipids, for which products and/or mass flux analysis have not been determined.

References

    1. Allen DK, Ohlrogge JB, Shachar-Hill Y (2009) The role of light in soybean seed filling metabolism. Plant J 58 220–234 - PubMed
    1. Allen DK, Shachar-Hill Y, Ohlrogge JB (2007) Compartment-specific labeling information in C-13 metabolic flux analysis of plants. Phytochemistry 68 2197–2210 - PubMed
    1. Andrews J, Keegstra K (1983) Acyl-CoA synthetase is located in the outer-membrane and acyl-CoA thioesterase in the inner membrane of pea chloroplast envelopes. Plant Physiol 72 735–740 - PMC - PubMed
    1. Bafor M, Smith MA, Jonsson L, Stobart K, Stymne S (1991) Ricinoleic acid biosynthesis and triacylglycerol assembly in microsomal preparations from developing castor-bean (Ricinus communis) endosperm. Biochem J 280 507–514 - PMC - PubMed
    1. Bates PD, Ohlrogge JB, Pollard M (2007) Incorporation of newly synthesized fatty acids into cytosolic glycerolipids in pea leaves occurs via acyl editing. J Biol Chem 282 31206–31216 - PubMed

Publication types

MeSH terms

LinkOut - more resources