

MMP9 and SCF protect from apoptosis in acute kidney injury
- PMID: 19329763
- PMCID: PMC2663840
- DOI: 10.1681/ASN.2008050515
MMP9 and SCF protect from apoptosis in acute kidney injury
Abstract
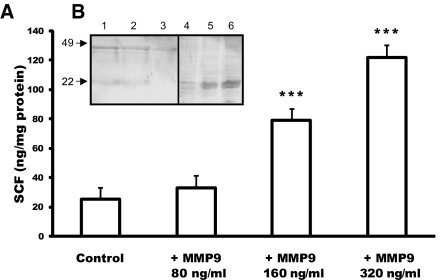
Apoptosis of tubular epithelial cells is a hallmark of acute kidney injury (AKI), but the cellular events preceding apoptosis in this setting are incompletely understood. Because matrix metalloproteinase 9 (MMP9) degrades matrix components involved in cell survival, we studied the role of MMP9 in AKI. In the mouse model of folic acid-induced AKI, we observed a marked increase of MMP9 activity in the S3 segment of the proximal tubule (S3PT), correlating with the apoptotic phase. MMP9 deficiency increased apoptosis and the severity of renal lesions and substantially delayed recovery of renal function. MMP9-/- mice exhibited significant apoptosis in the S3PT and the intercalated cells of the collecting duct (I-CD), whereas wild-type mice exhibited none in these segments. Stem cell factor (SCF), an MMP9 substrate, was identified in the S3PT, and its receptor, c-Kit, was expressed in both the S3PT and I-CD. MMP9 released the soluble form of SCF (sSCF) from kidney cells in vivo and in vitro. In addition, SCF inhibited apoptosis of tubular cells in vitro, rescued MMP9-/- S3PT and I-CD from apoptosis in vivo, and improved renal function. An ischemia-reperfusion model of AKI produced similar results. In patients with AKI, urinary sSCF increased with acute tubular necrosis but not with prerenal azotemia. In conclusion, these data show that MMP9 protects the S3 segment of the proximal tubule and the I-CD from apoptosis in AKI, most likely by releasing sSCF.
Figures
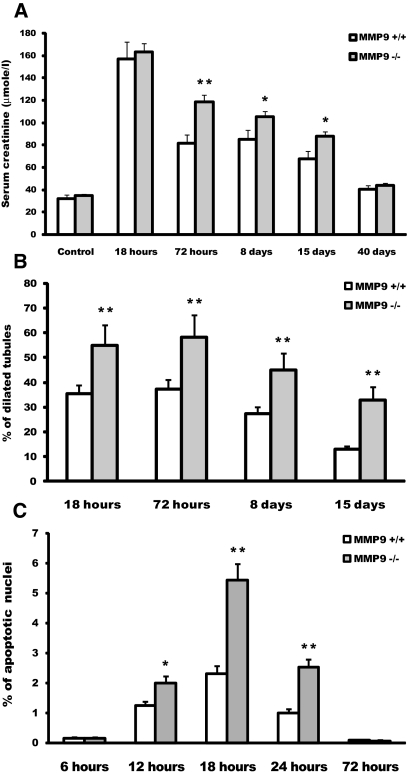
 ) mice injected with bicarbonate vehicle (Control) or FA. (B) Percentage of dilated tubules in MMP9+/+ and MMP9−/− kidney sections. Five microphotographs were taken from six different MMP9−/− and MMP9+/+ kidneys. (C) Percentage of apoptotic nuclei. Six microphotographs were taken from six different MMP9+/+ and MMP9−/− kidneys. Data are means ± SEM. **P < 0.001 versus MMP9+/+ injected mice; *P < 0.01 versus MMP9+/+ injected mice. Magnification, ×400.
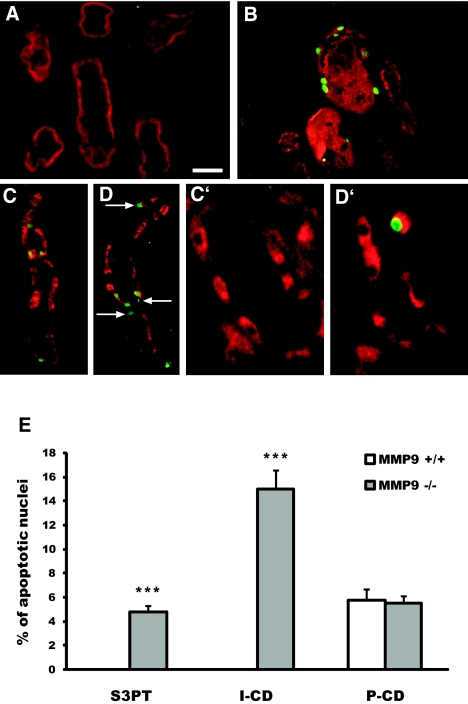
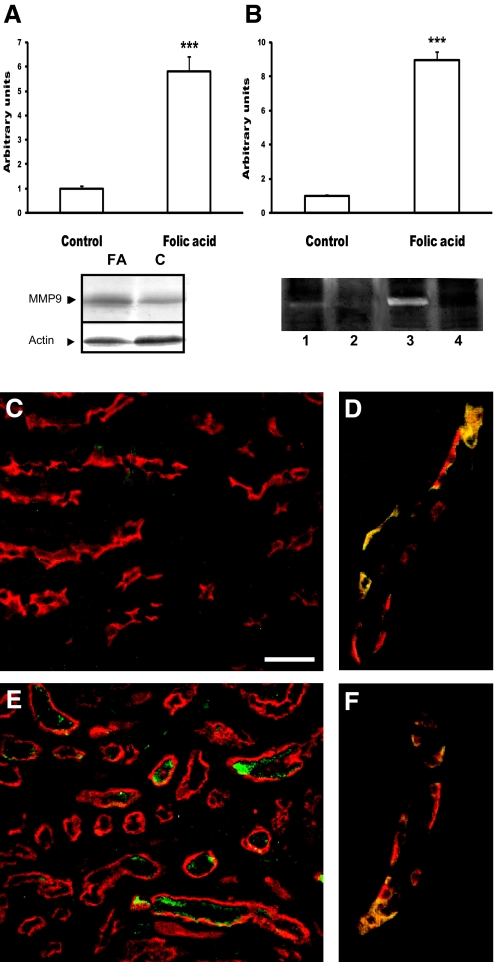
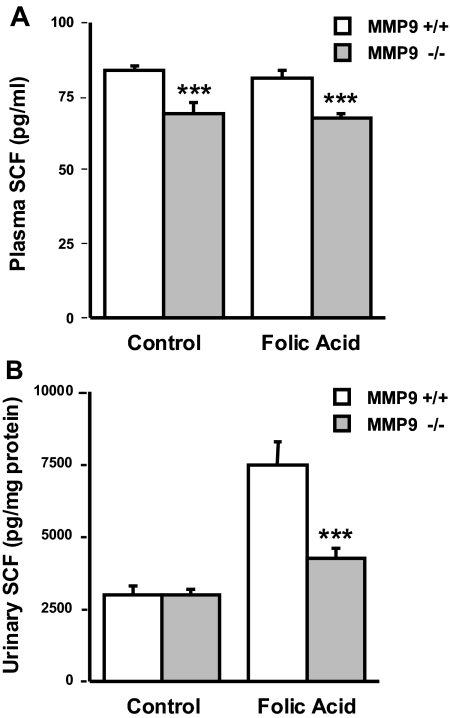 ) mice injected with bicarbonate vehicle (Control) or with FA at 18 h. SCF concentration was significantly lower (P < 0.005; n = 5) in the plasma of MMP9−/− compared with MMP9+/+ mice. (B) Urinary sSCF normalized to urinary protein in MMP9+/+ (□) and MMP9−/− () mice injected with vehicle (Control) or FA. Urinary SCF was not significantly different between control MMP9+/+ and MMP9−/− mice. It significantly increased in both groups of FA-injected mice compared with their respective controls (MMP9+/+ mice P < 0.001; MMP9−/− mice P < 0.002; n = 6), but the increase was significantly less in MMP9−/− mice compared with MMP9+/+ mice. ***P < 0.001 (n = 6).
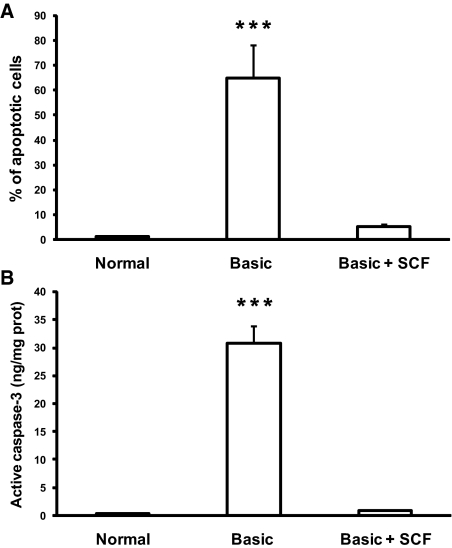
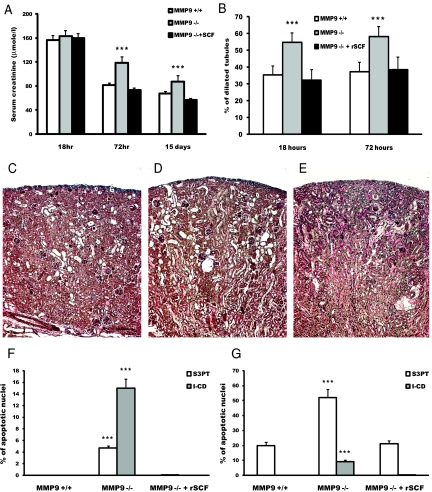 ) and MMP9−/− mice rescued with SCF (▪) 18 h, 72 h, and 15 d after FA injection. Serum creatinine concentrations were not statistically different in MMP9+/+ mice and in MMP9−/− mice injected with recombinant SCF. Data are means ± SEM, ***P < 0.001. (B) Percentage of dilated tubules in MMP9+/+, MMP9−/−, and MMP9−/− mice rescued with SCF 18 and 72 h after FA injection. Five microphotographs taken from six different kidneys were analyzed. Percentage of dilated tubules was not statistically different in MMP9+/+ mice and in MMP9−/− mice injected with rSCF. Data are means ± SEM. ***P < 0.001. (C through E) Photomicrographs of representative paraffin kidney sections stained with periodic-acid Schiff from MMP9+/+ (C), MMP9−/− (D), and MMP9−/− mice rescued with SCF (E) 18 h after FA injection. Bar = 170 μm. (F and G) Percentage of apoptotic cells in S3PT and I-CD. Six microphotographs of six different kidneys sampled from MMP9+/+, MMP9−/−, and MMP9−/− mice rescued with SCF were analyzed 18 h after FA injection (F) and 24 h after reperfusion in the clamped kidney (G). Apoptosis observed in S3PT and I-CD was not statistically different in MMP9+/+ mice and in MMP9−/− mice injected with recombinant SCF+. Data are means ± SEM, ***P < 0.001; **P < 0.01 versus MMP9+/+ or MMP9−/− injected with SCF.
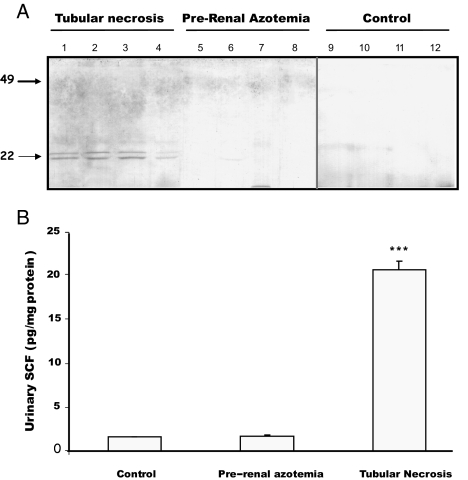
References
-
- Kribben A, Edelstein C, Schrier RW: Pathophysiology of acute renal failure. J Nephrol 12: S142–S151, 1999 - PubMed
-
- Lovett DH, Sterzel RB, Kashgarian M, Ryan JL: Neutral proteinase activity produced in vitro by cells of the glomerular mesangium. Kidney Int 23: 342–349, 1983 - PubMed
-
- Piedagnel R, Murphy G, Ronco P, Lelongt B: Matrix metalloproteinase 2 (MMP2) and MMP9 are produced by kidney collecting duct principal cells but are differentially regulated by SV40 large T, arginine vasopressin, and epidermal growth factor. J Biol Chem 274: 1614–1620, 1999 - PubMed
-
- Legallicier B, Trugnan G, Murphy G, Lelongt B, Ronco P: Expression of the type-IV collagenase during mouse kidney development and tubule segmentation. J Am Soc Nephrol 12: 2358–2369, 2001 - PubMed
-
- Van den Steen PE, Dubois B, Nelissen I, Rudd PM, Dwek RA, Opdenakker G: Biochemistry and molecular biology of gelatinase B or matrix metalloproteinase-9 (MMP-9). Crit Rev Biochem Mol Biol 37: 375–536, 2002 - PubMed
Publication types
MeSH terms
Substances
Grants and funding
LinkOut - more resources
Full Text Sources
Other Literature Sources
Medical
Molecular Biology Databases
Miscellaneous
