. 2009 May;11(5):545-56.
doi: 10.1038/ncb1861. Epub 2009 Mar 29.

Protein kinase D1 regulates cofilin-mediated F-actin reorganization and cell motility through slingshot

Affiliations

Protein kinase D1 regulates cofilin-mediated F-actin reorganization and cell motility through slingshot

Tim Eiseler et al. Nat Cell Biol. 2009 May.

Abstract

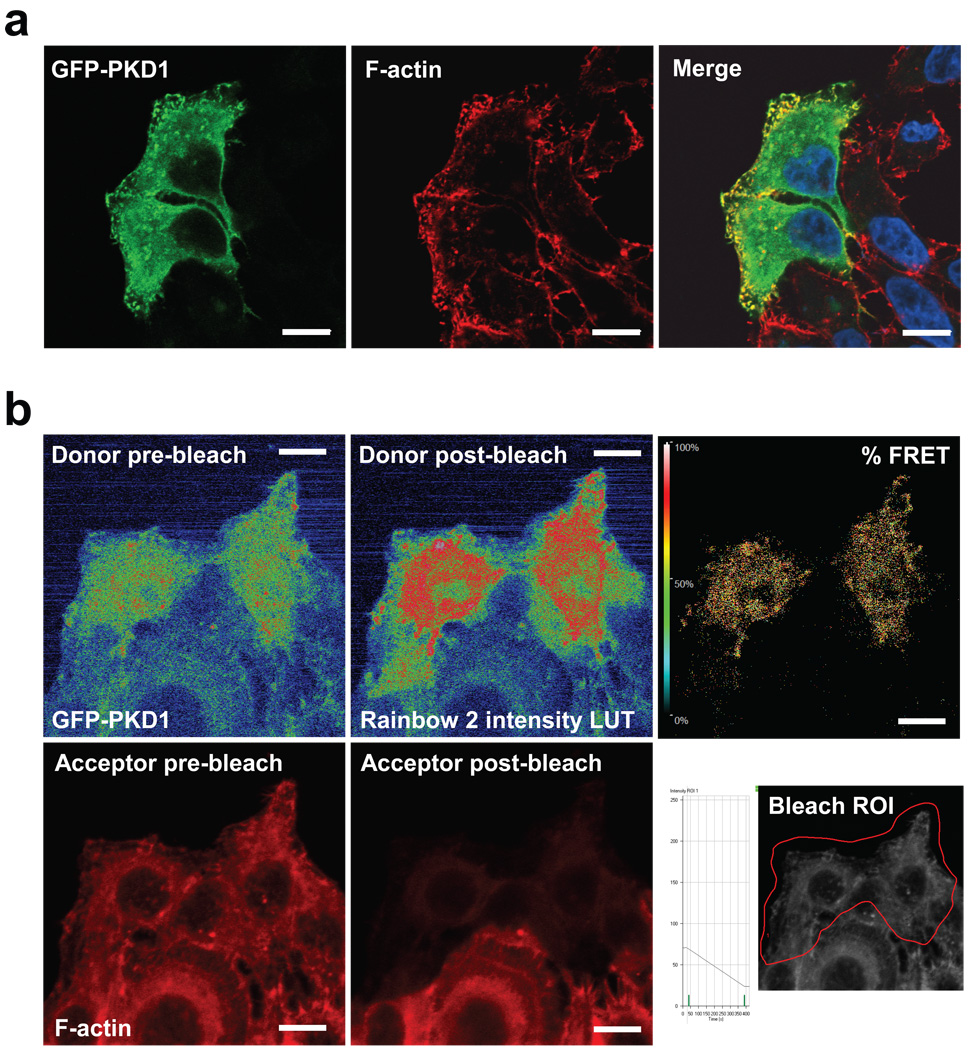
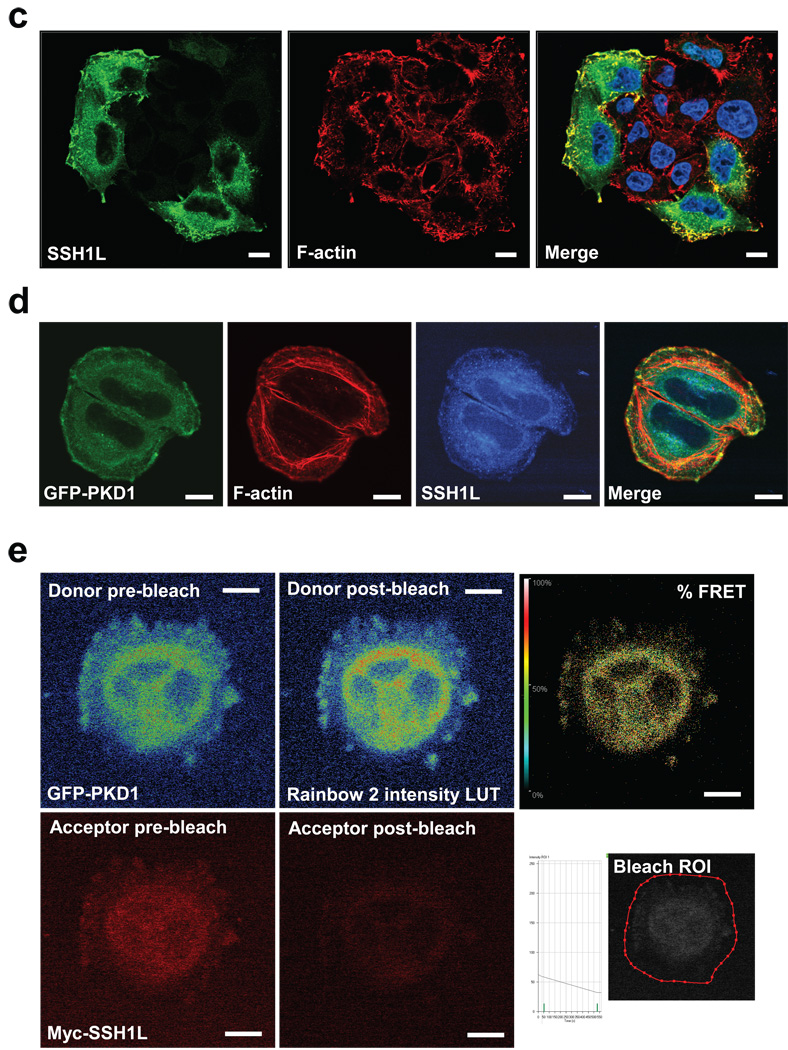
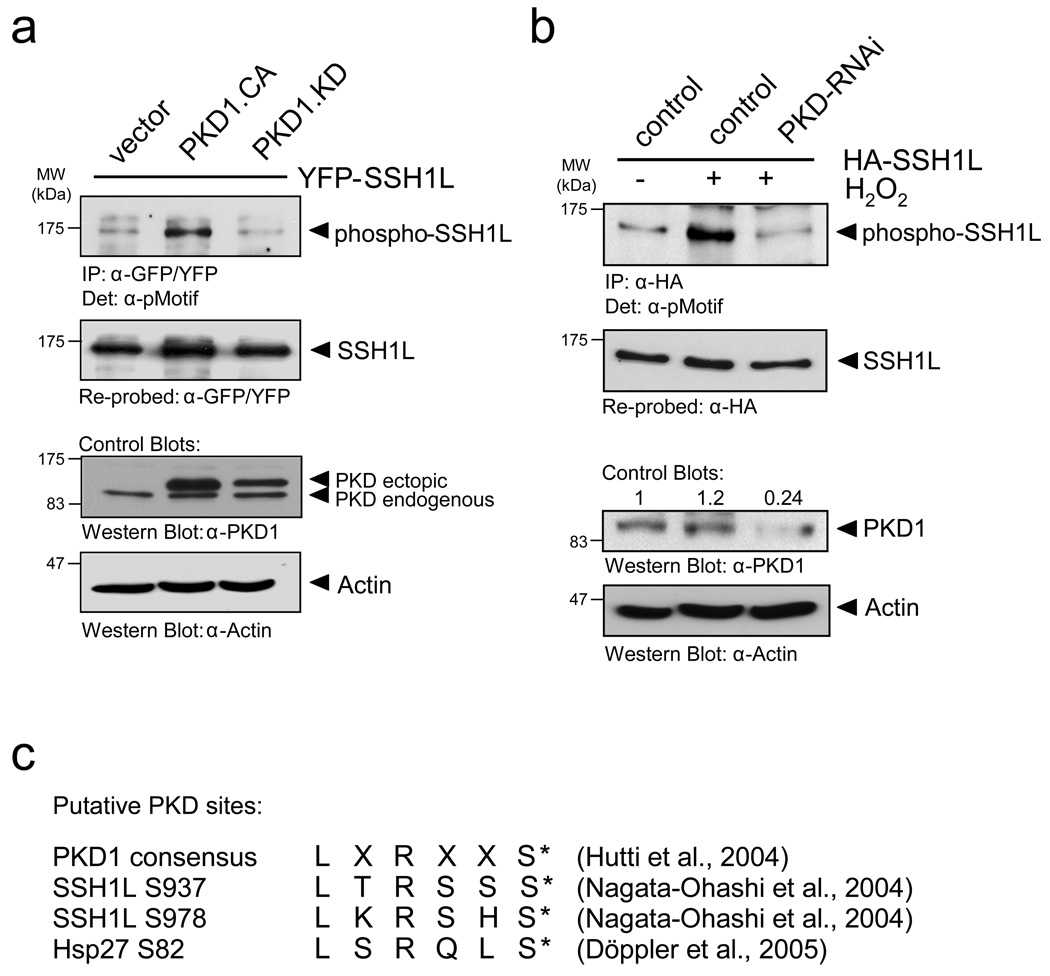
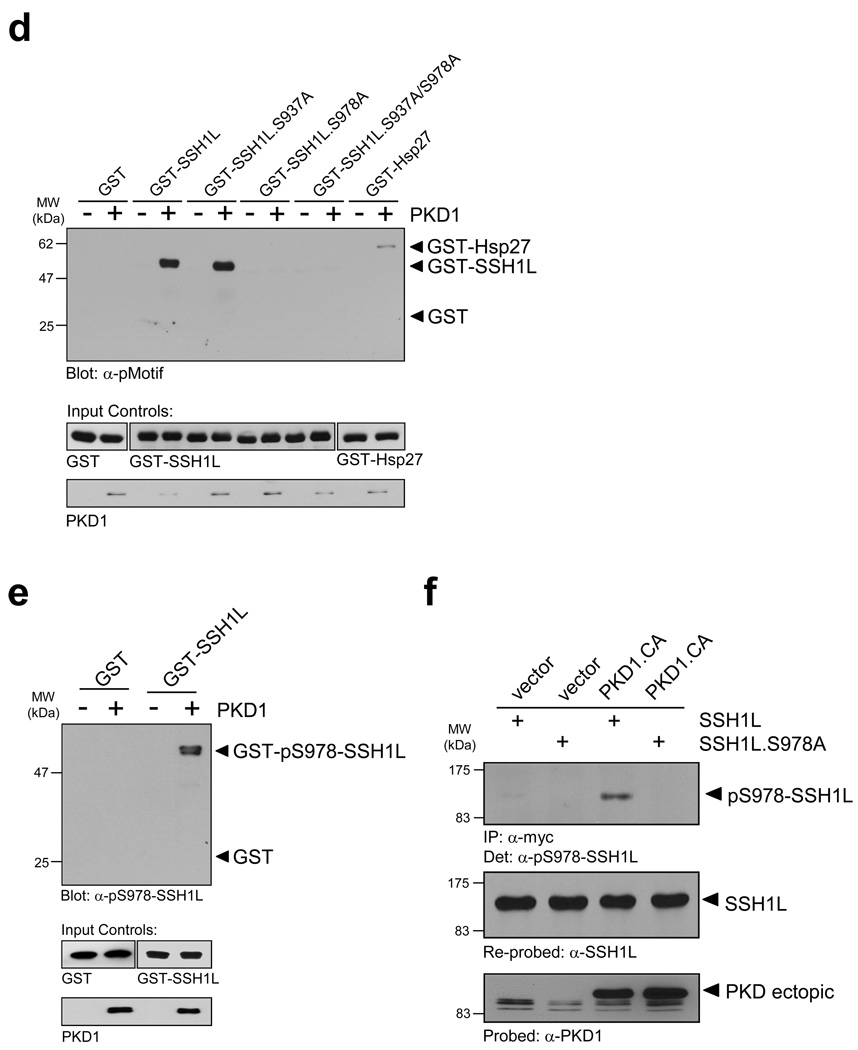
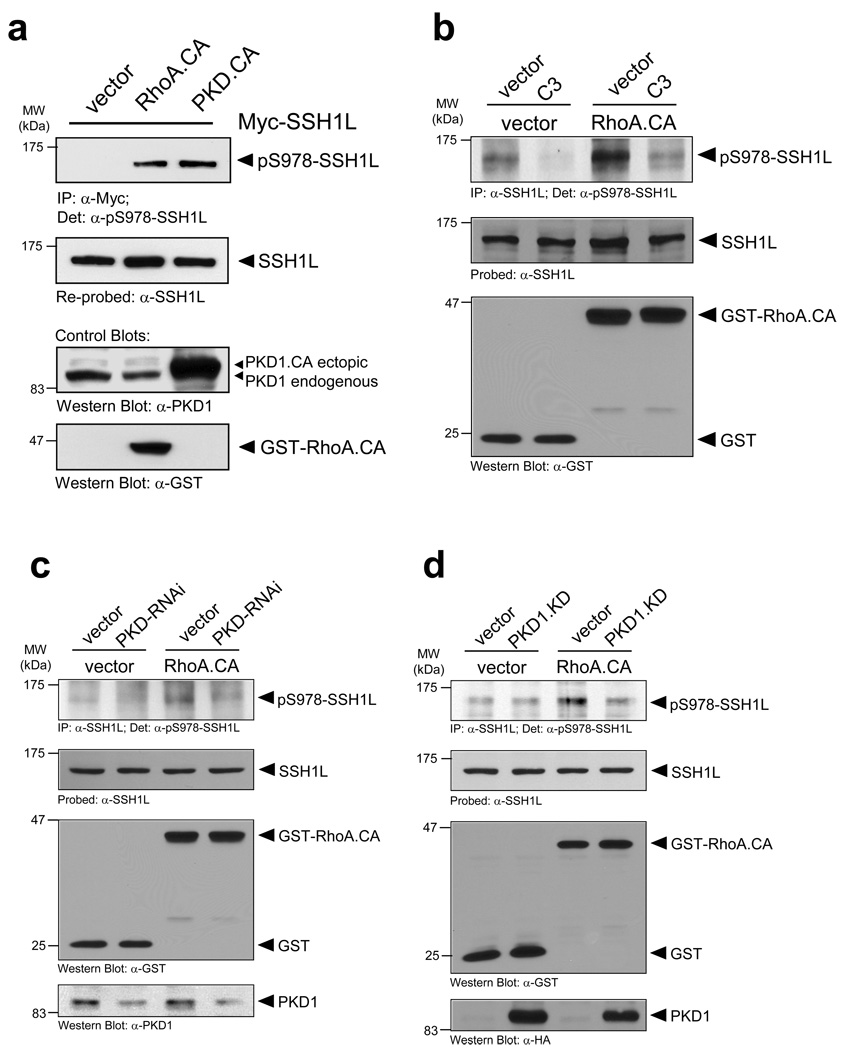
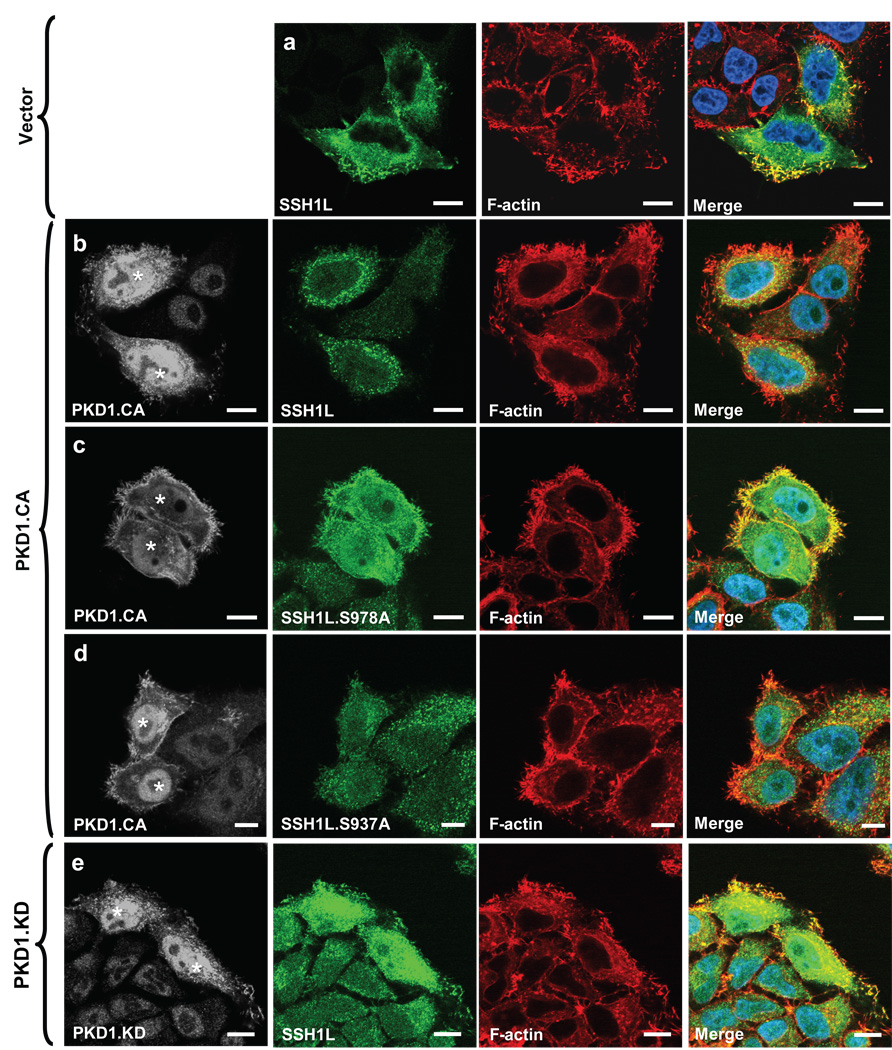
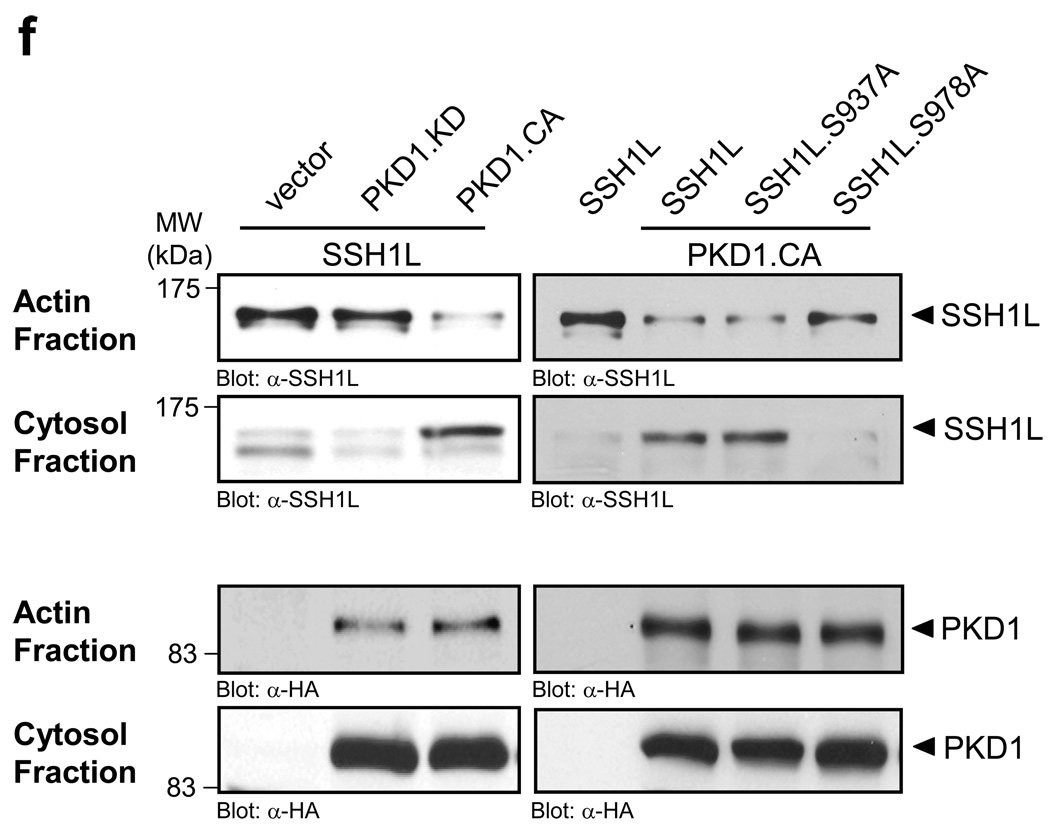
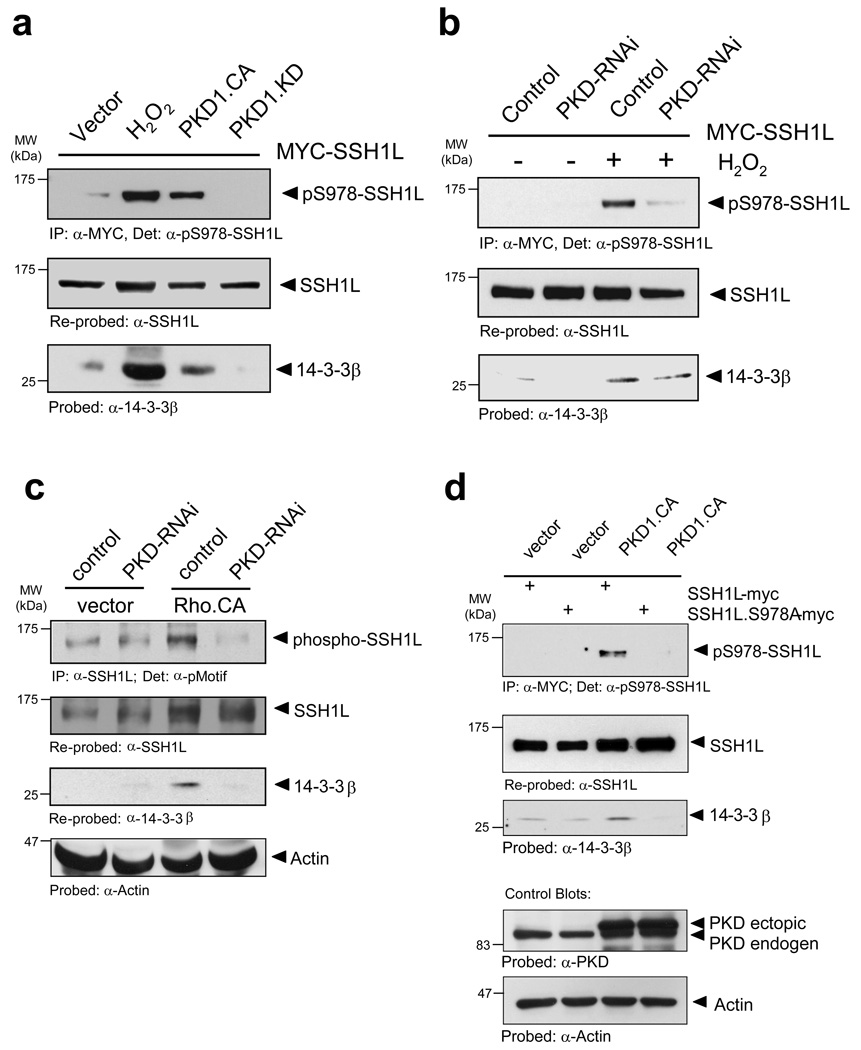
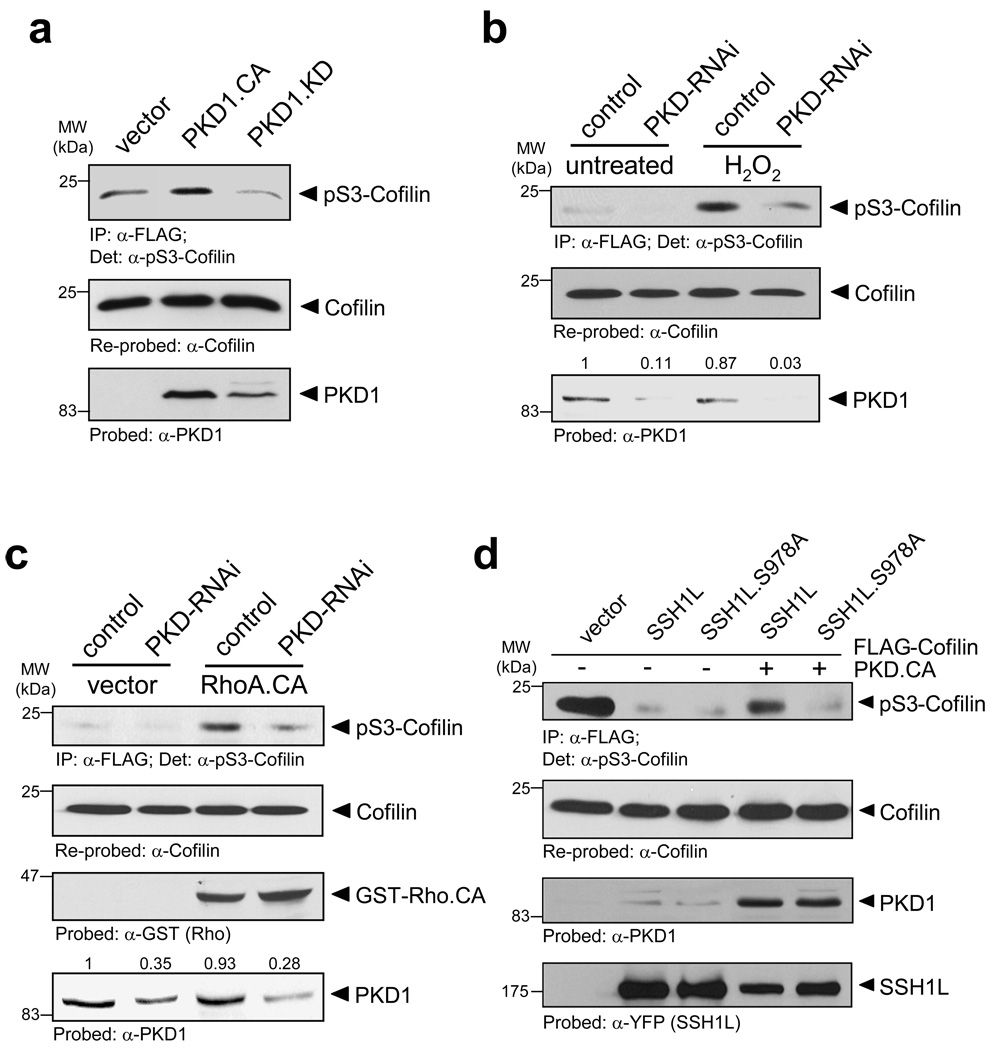
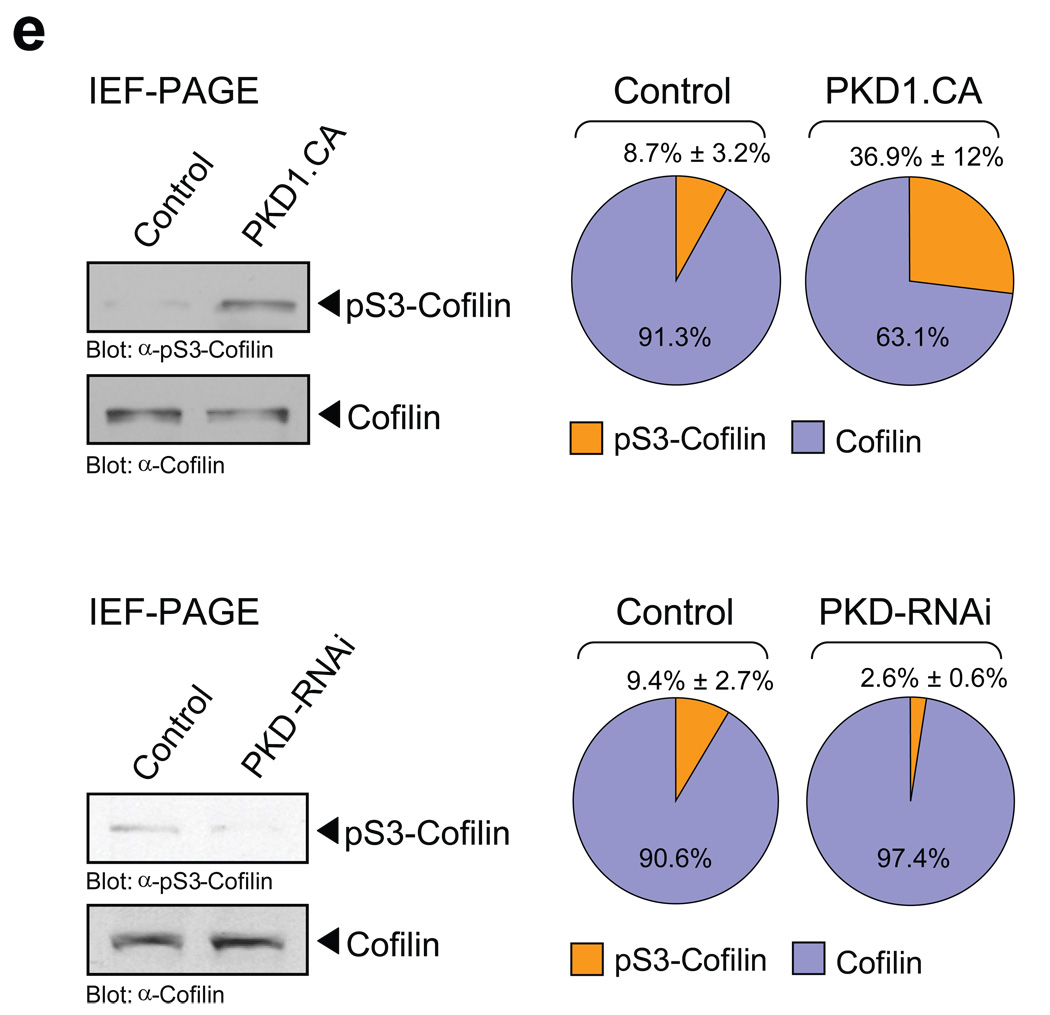
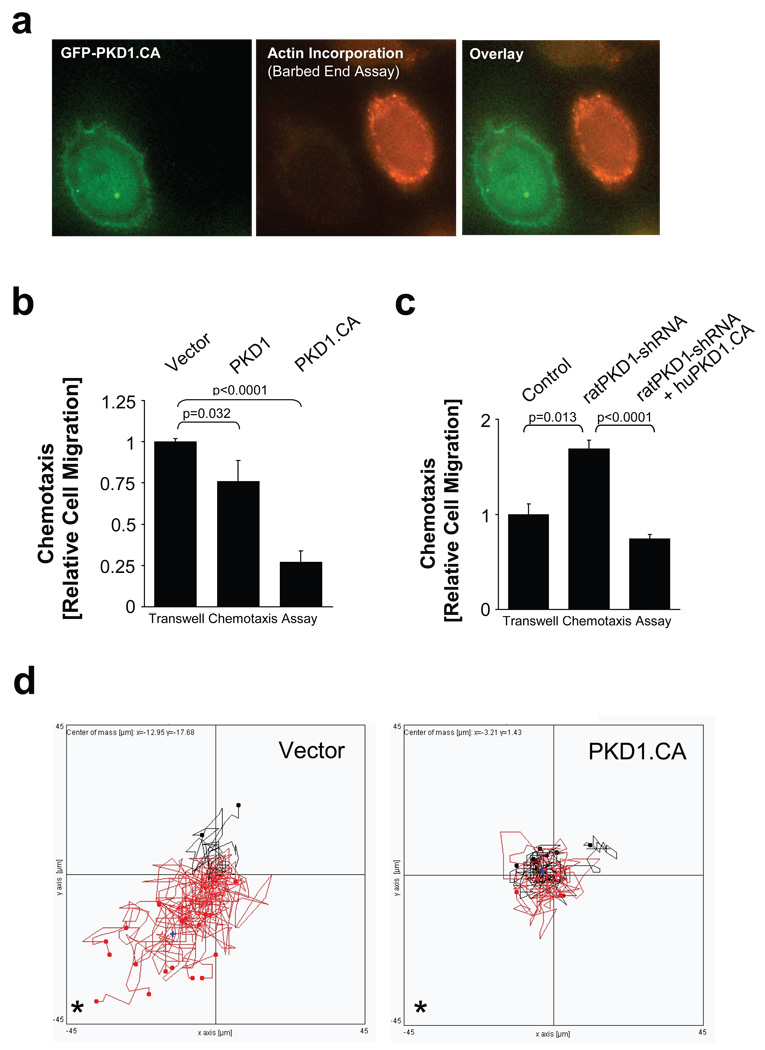
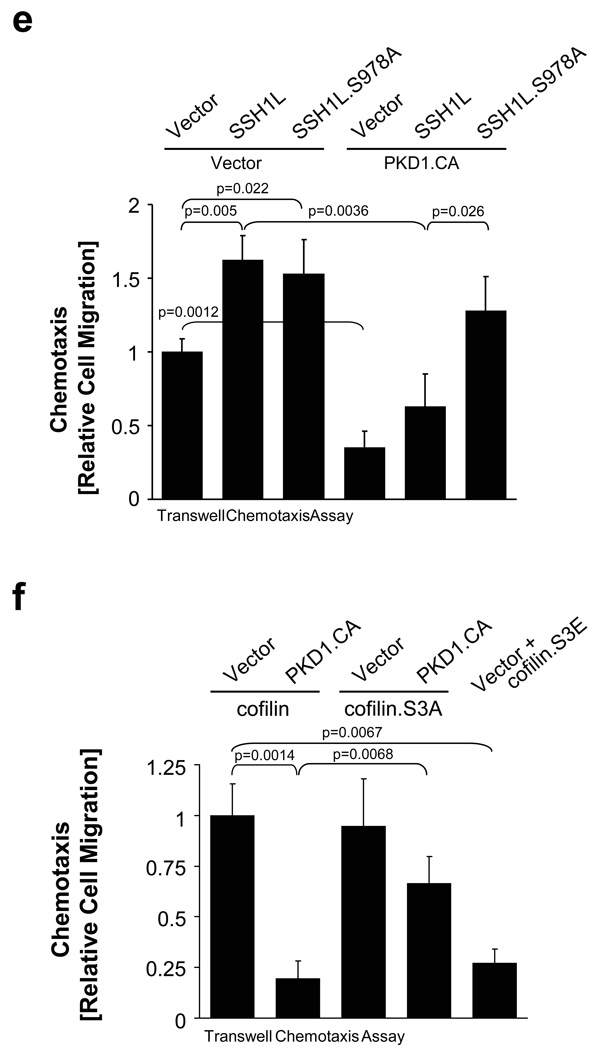
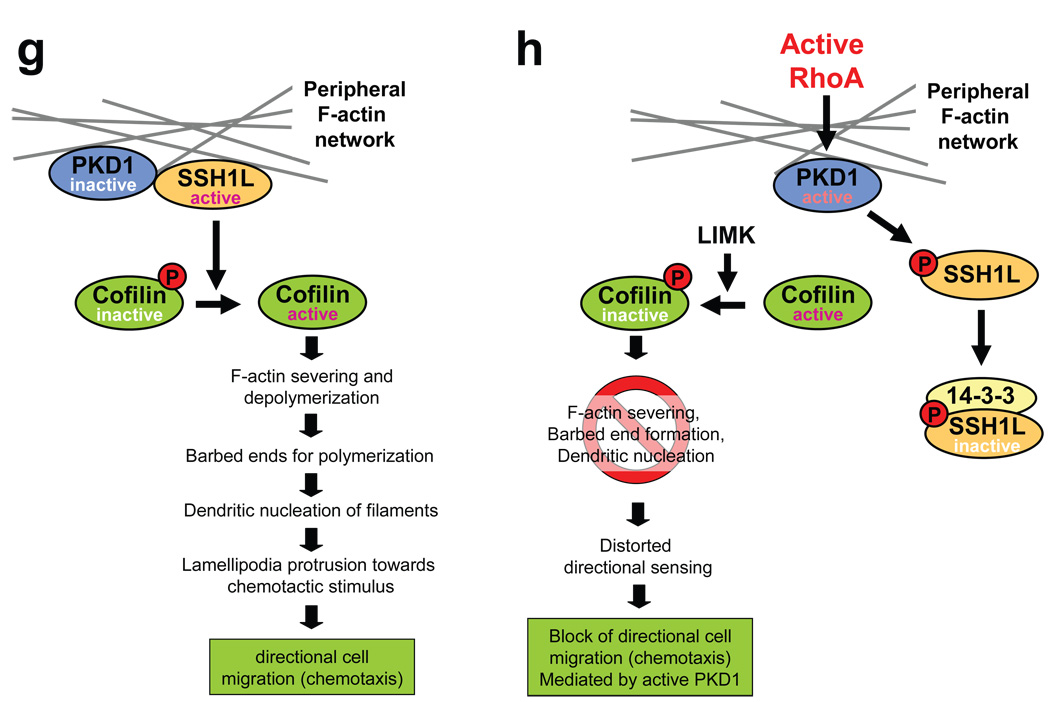
Dynamic actin remodelling processes at the leading edge of migrating tumour cells are concerted events controlled by a fine-tuned temporal and spatial interplay of kinases and phosphatases. Actin severing is regulated by actin depolymerizing factor (ADF)/cofilin, which regulates stimulus-induced lamellipodia protrusion and directed cell motility. Cofilin is activated by dephosphorylation through phosphatases of the slingshot (SSH) family. SSH activity is strongly increased by its binding to filamentous actin (F-actin); however, other upstream regulators remain unknown. Here we show that in response to RhoA activation, protein kinase D1 (PKD1) phosphorylates the SSH enzyme SSH1L at a serine residue located in its actin-binding motif. This generates a 14-3-3-binding motif and blocks the localization of SSH1L to F-actin-rich structures in the lamellipodium by sequestering it in the cytoplasm. Consequently, expression of constitutively active PKD1 in invasive tumour cells enhanced the phosphorylation of cofilin and effectively blocked the formation of free actin-filament barbed ends and directed cell migration.


Figures

Figure 1
Figure 1. Co-localization of PKD1 with SSH1L at peripheral F-actin structures
a, Immunofluorescence analysis of HeLa cells stained for PKD1 (GFP-PKD1) and F-actin (Rhodamine-Phalloidin) using confocal microscopy. Nuclei were stained with DAPI. b, PKD1 and F-actin are in proximity to facilitate Foerster energy transfer. HeLa cells were transfected with GFP-tagged PKD1 and stained for F-actin (Rhodamine-Phalloidin). A time bleach image series was acquired using a Zeiss LSM 510META confocal microscope with a Plan-Apochromat 63× /1.4 Dic oil immersion objective. Raw data was captured and analyzed using the LSM Software FRETplus Macro in Channel Mode. 4 pre- and post-bleach images of donor (GFP-PKD1) and acceptor (Rhodamine-Phalloidin) were recorded. The acceptor was photo-bleached using the 543 nm laser at 100 % transmission. The donor was exited at 488 nm using META-Detector Channels 490–543 for detection while the acceptor was exited at 543 nm using detection channels 560–635. The first pre- and post-bleach image of the series for donor and acceptor are shown. For better visualization of the donor fluorescence intensity a Rainbow2 LUT was applied to the images. The bleach ROI is shown below the % FRET image. c, Immunofluorescence analysis of HeLa cells stained for endogenous SSH1L and F-actin (Rhodamine-Phalloidin) using confocal microscopy. Nuclei were stained with DAPI. d, PKD1, SSH1L and F-actin co-localize at the edge of lamellipodia. HeLa cells were transfected with GFP-PKD1. Samples were stained with a α-SSH1L antibody directly labeled with Alexa Fluor 350 dye and with Rhodamine-Phalloidin. e, PKD1 and SSH1L-myc are in proximity to facilitate Foerster energy transfer. HeLa cells were transfected with GFP-PKD1 and Myc-SSH1L. SSH1L was indirectly labelled using α-myc and Alexa Fluor 568 antibodies. A time bleach image series was acquired. 3 pre- and 3 post-bleach images of donor (GFP-PKD1) and acceptor (Alexa Fluor 568) were recorded. The acceptor was photo-bleached using the 594 nm laser to reduce donor bleaching artefacts at 100 % transmission with a high number of iterations. FRET images were acquired and visualized as described above. In all experiments the scale bar represents 10 µm.
Figure 2
Figure 2. PKD1 phosphorylates SSH1L in vitro and in vivo
a, HeLa cells were co-transfected with YFP-SSH1L and vector, constitutively-active PKD1 (PKD1.CA) or kinase-inactive PKD1 (PKD1.KD). SSH1L was immunoprecipitated with a α-GFP/YFP antibody and analyzed for phosphorylation by PKD1 using the α-pMotif PKD-substrate antibody. Blots were re-probed for SSH1L expression and control blots indicate PKD1 transgene expression (α-PKD1) or equal loading (α-actin). b, HeLa cells were transfected with RNAi control or PKD-RNAi. The next day cells were transfected with HA-SSH1L. After 48h, cells were stimulated with H2O2 (10 mM, 10 min) as indicated. SSH1L was immunoprecipitated (α-HA) and samples were analyzed using the α-pMotif PKD-substrate antibody. Blots were re-probed for SSH1L expression and control blots were probed with α-actin (loading control) or α-PKD1 (to show effective knockdown; numbers show knockdown of PKD1 relative to control). c, The PKD1 consensus motif indicates preference for serines with an arginine at -3 and leucine at -5 relative to the phosphorylated serine. Both serines, Ser937 and Ser978, in the serine-rich region of SSH1L fulfill the criteria of ideal phosphorylation consensus sequences. Also shown is the phosphorylation sequence of the known PKD1 substrate Hsp27. d, Purified GST-fusion proteins of SSH1L encompassing the putative PKD1 phosphorylation sites S937 and S978 as well as fusion proteins of SSH1L.S937A, SSH1L.S978A and SSH1L.S937A/S978A mutants were subjected a PKD1 kinase assay. Substrate phosphorylation was detected with the α-pMotif PKD-substrate antibody. Purified GST alone or GST-Hsp27 served as negative or positive controls. Control blots show substrate loading (α-GST) and PKD1 (α-PKD1). e, Purified GST (control) and GST-SSH1L were subjected to an in vitro kinase reaction with purified, active PKD1. Western blots of resolved proteins were probed with α-pS978-SSH1L. Control blots show substrate loading (α-GST) and PKD1 (α-PKD1). f, HeLa cells were co-transfected with Myc-tagged SSH1L or SSH1L.S978A and vector or constitutively-active PKD1 (PKD1.CA). SSH1L was immunoprecipitated (α-myc) and analyzed for phosphorylation at S978 (α-pS978-SSH1L). Blots were re-probed for SSH1L expression (α-SSH1L) and control blots were probed for PKD1 (α-PKD1). Uncropped images of Figs. 2a, 2d and 2f are shown in Supplementary information Fig. S6.
Figure 3
Figure 3. PKD1 phosphorylates SSH1L downstream of RhoA
a, Active RhoA and active PKD1 mediate SSH1L phosphorylation at S978. HeLa cells were co-transfected with myc-tagged SSH1L and vector, constitutively-active RhoA (RhoA.CA) or PKD1 (PKD1.CA). SSH1L was immunoprecipitated (α-myc) and samples were analyzed with α-pS978-SSH1L. Blots were re-probed for SSH1L (α-SSH1L). Control blots showing PKD1 and RhoA.CA transgene expression were performed by Western blotting using anti-PKD1 or anti-GST antibodies as indicated. b, Phosphorylation of endogenous SSH1L is dependent on RhoA. HeLa cells were transfected with vector control or active RhoA.CA and treated with C3 transferase as indicated. SSH1L was immunoprecipitated (α-SSH1L) and analyzed for phosphorylation at S978 (α-pS978). Blots were re-probed for SSH1L. Control blots showing RhoA.CA transgene expression were performed by Western blotting using α-GST antibodies. c, HeLa cells were transfected with RNAi control or PKD-RNAi. The next day cells were transfected with vector or constitutively-active RhoA (RhoA.CA). Endogenous SSH1L was immunoprecipitated (α-SSH1L) and analyzed for PKD1-mediated phosphorylation (α-pS978). Blots were re-probed for SSH1L (α-SSH1L). Control blots showing PKD1 (numbers show knockdown of PKD1 relative to control) and RhoA.CA transgene expression were performed by Western blotting using α-PKD1 or α-GST antibodies as indicated. A quantification of SSH1L phosphorylation at S978 from four different experiments is depicted in Fig. S6 (supplemental information). d, HeLa cells were co-transfected with vector control or PKD1.KD and constitutively-active RhoA (RhoA.CA). Endogenous SSH1L was immunoprecipitated (α-SSH1L) and analyzed for PKD1-mediated phosphorylation (α-pS978). Blots were re-probed for SSH1L (α-SSH1L). Control blots showing PKD1 and RhoA.CA transgene expression were performed by Western blotting using α-PKD1 or α-GST antibodies as indicated. Uncropped images of Fig. 3d are shown in Supplementary information Fig. S6.
Figure 4
Figure 4. PKD1-mediated phosphorylation regulates SSH1L localization
a–e, HeLa cells were co-transfected with vector control (a), constitutively-active PKD1 (PKD1.CA) (b–d) or kinase-dead PKD1 (PKD1.KD) (e) and Myc-tagged SSH1L, SSH1L.S937A orSSH1L.S978A (as indicated). Samples were subjected to indirect immunofluorescence analysis. SSH1L was detected using α-myc and Alexa Fluor 568 secondary antibodies. F-actin was stained with Alexa Fluor 633-Phalloidin and nuclei were stained with DAPI. PKD1 expression was detected using a HA-specific antibody and α-rabbit-Alexa Fluor 488 as a secondary antibody. The nuclear staining in the PKD1 samples is non-specific background. Samples were analyzed using a Zeiss LSM 510META confocal microscope with a Plan-Apochromat 63×/1.4 Dic oil immersion objective in Multi-Track-configuration. For visualization purposes, PKD1 images are presented in grayscale, SSH1L in green and Phalloidin in red. Double transfected cells (PKD1 and SSH1L) are marked with asterisks. Images shown depict single confocal sections. The scale bar represents 10 µm. f, HeLa cells were co-transfected with vector control, constitutively-active PKD1 (PKD1.CA) or kinase-dead PKD1 (PKD1.KD) and Myc-tagged SSH1L, SSH1L.S937A or SSH1L.S978A as indicated. Actin fraction or cytosolic fraction of cells were prepared and analyzed for SSH1L (α-SSH1L). Control blots for PKD1 expression were performed using α-HA antibodies. Uncropped images of Fig. 4f are shown in supplementary information Fig. S6. Control figures for 4b, 4c and 4d are shown in Supplementary information S3A.
Figure 5
Figure 5. Phosphorylation of SSH1L at S978 controls its association with 14-3-3 proteins
a, HeLa cells were transfected with myc-SSH1L and vector, constitutively-active PKD1 (PKD1.CA) or kinase-dead PKD1 (PKD1.KD). Where indicated, cells were stimulated with H2O2 (10 mM, 10 min). SSH1L was immunoprecipitated (α-myc) and samples were stained for phosphorylation at S978 (α-pS978-SSH1L) and re-probed for total SSH1L (α-SSH1L). Co-precipitation of 14-3-3 was detected using a α-14-3-3β antibody. b, HeLa cells were transfected with control or PKD-RNAi. Next day, cells were transfected with Myc-SSH1L. After 48 h, cells were stimulated with H2O2 (10 mM, 10 min) as indicated. SSH1L was immunoprecipitated (α-myc) and samples were stained for phosphorylation at S978 (α-pS978-SSH1L) and re-probed for SSH1L (α-SSH1L). Co-precipitation of 14-3-3 was detected using a α-14-3-3βantibody. c, HeLa cells were transfected with RNAi control or PKD-RNAi. Next day, cells were transfected with vector or constitutively-active RhoA (RhoA.CA). Endogenous SSH1L was immunoprecipitated (α-SSH1L) and analyzed for co-immunopecipitation of 14-3-3β (α-14-3-3β). As control, samples were also stained for SSH1L phosphorylation at S978 (α-pMotif) and equal loading (α-actin). d, HeLa cells were co-transfected with Myc-tagged SSH1L or SSH1L.S978A and vector or constitutively-active PKD1 (PKD1.CA). SSH1L was immunoprecipitated (α-myc) and analyzed for co-immunopecipitation of 14-3-3 (α-14-3-3β). As control, samples were also stained for SSH1L phosphorylation at S978 (α-pS978-SSH1L) or equal loading (α-actin). e, HeLa cells were transfected with Myc-tagged SSH1L or SSH1L.S978A and HA-14-3-3ζ. 14-3-3ζ was stained using a α-HA (rat) antibody followed by detection with α-rat Alexa Fluor 488. SSH1L was detected using α-myc and Alexa Fluor 568 antibodies. F-actin was stained with Alexa Fluor 633-Phalloidin and nuclei with DAPI. Samples were analyzed using a Zeiss LSM 510META confocal microscope with a Plan-Apochromat 63×/1.4 Dic oil immersion objective in Multi-Track-configuration. E1–E4: Controls transfected with SSH1L and co-stained for F-actin. E5–E8: Cells transfected with SSH1L, 14-3-3ζ and co-stained for F-actin. E9–E12: Cells transfected with SSH1L.S978A and co-stained for F-actin. E13-E16: Cells transfected with SSH1L.S978A, 14-3-3ζ and co-stained for F-actin. Images show single confocal sections. The scale bar represents 10 µm. Uncropped images of Figs. 5c and 5d are shown in Supplementary information Fig. S6.
Figure 6
Figure 6. PKD1 regulates cofilin S3-phosphorylation
a, HeLa cells were transfected with vector, constitutively-active PKD1 (PKD1.CA) or kinase-dead PKD1 (PKD1.KD) and FLAG-tagged cofilin. Cofilin was immunoprecipiated (α-FLAG), cofilin phosphorylation was detected with α-pS3-cofilin antibody and samples were re-probed for total cofilin (α-FLAG). The expression of PKD1 was verified by Western blotting (α-PKD1). b, HeLa cells were transfected with control RNAi or PKD-RNAi. The next day, cells were transfected with FLAG-tagged cofilin. Cofilin was immunoprecipiated (α-FLAG), cofilin phosphorylation was detected with α-pS3-cofilin antibody and samples were re-probed for total cofilin (α-FLAG). The knockdown of PKD1 was verified by Western blotting (α-PKD1) and numbers show knockdown of PKD1 relative to control. A quantification of cofilin phosphorylation at S3 from three different experiments is depicted in Fig. S9A (supplemental information). c, HeLa cells were transfected with control RNAi or PKD-RNAi. The next day, cells were transfected with FLAG-tagged cofilin and constitutively-active RhoA (RhoA.CA). Cofilin was immunoprecipiated (α-FLAG), cofilin phosphorylation was detected by probing with α-pS3-cofilin antibody and samples were re-probed for total cofilin (α-FLAG). The expression of RhoA and the knockdown of PKD1 were verified by Western blotting (α-GST and α-PKD1). Numbers show knockdown of PKD1 relative to control. A quantification of cofilin phosphorylation at S3 from three different experiments is depicted in Fig. S9B (supplemental information). d, HeLa cells were co-transfected with FLAG-tagged cofilin, vector control, SSH1L, SSH1L.S978A and constitutively-active PKD1 (PKD1.CA) as indicated. Cofilin was immunoprecipiated (α-FLAG), cofilin phosphorylation was detected by probing with α-pS3-cofilin antibody and samples were re-probed for total cofilin (α-FLAG). The expression of PKD1 and SSH1L was verified by Western blotting (α-PKD1 or α-YFP). e, HeLa cells were transfected with vector control, constitutively-active PKD1 (PKD1.CA), RNAi control or PKD1-RNAi as indicated. Cell lysates were subjected to IEF-PAGE to separate endogenous S3-phosphorylated and unphosphorylated cofilin. Samples were analyzed with α-S3-cofilin and α-cofilin antibodies. The Western blot show representative experiments. The ratio of phospho-cofilin/cofilin of three independent experiments is depicted in the right panel. Uncropped images of Fig. 6a are shown in Supplementary information Fig. S6.
Figure 7
Figure 7. PKD1 regulates the formation of free actin filament barbed ends and cell migration
a, MTLn3 cells were transfected with constitutively-active GFP-PKD1 and a free actin filament barbed end assay performed. Depicted is a PKD1-transfected cell (green) next to a non-transfected cell (see also Fig.S10). Free barbed ends are shown in red. b, MTLn3 cells were transfected with vector, wildtype or PKD1.CA. Transwell chemotaxis assays were performed for 4 h. Statistically-significant changes (student T-Test) to the control are marked with asterisks. c, MTLn3 cells were transfected with control shRNA or shRNA specific for rat PKD1 as well as human PKD1.CA as indicated. Transwell chemotaxis assays were performed for 4 h. Statistically-significant changes (student T-Test) to control are marked with asterisks. d, MTLn3 cells were transfected with vector control or PKD1.CA. Cells were seeded on µ-Slides Chemotaxis chambers and induced to migrate for 6 h towards NIH-3T3-conditioned medium. Data obtained from several experiments were pooled. The asterisk marks the direction of the gradient. The blue cross marks the centre of mass (vector control:×= −12.95 µm, y = −17.68 µm; PKD1.CA (x = −3.21 µm, y = 1.43 µm). Tracks of cells overall migrating towards the gradient are shown in red, tracks of cells overall migrating in the other direction in black. e, MTLn3 cells were transfected with as indicated. Transwell chemotaxis assays were performed for 4 h. Statistically-significant changes (student T-Test) to the respective controls are marked with asterisks. f, MTLn3 cells were transfected as indicated. Transwell chemotaxis assays were performed for 4 h. Statistically-significant changes (student T-Test) to the respective controls are marked with asterisks. In 7b, 7c, 7e, 7f error bars represent standard deviation (n=3). g, h, In migrating cells active PKD1 co-localizes with active SSH1L at F-actin filaments. This allows SSH1L to dephosphorylate cofilin and keep it in an active state. Active cofilin induces actin severing and depolymerisation contributing to directional cell migration. After its activation PKD1 phosphorylates SSH1L at S978. This mediates 14-3-3 binding and inactivation of SSH1L. LIMK keeps cofilin in a phosphorylated, inactive state, blocking F-actin severing, barbed end formation and directional cell migration.

References

    1. Bamburg JR, McGough A, Ono S. Putting a new twist on actin: ADF/cofilins modulate actin dynamics. Trends Cell Biol. 1999;9:364–370. - PubMed
    1. Pollard TD, Borisy GG. Cellular motility driven by assembly and disassembly of actin filaments. Cell. 2003;112:453–465. - PubMed
    1. Yamaguchi H, Condeelis J. Regulation of the actin cytoskeleton in cancer cell migration and invasion. Biochim Biophys Acta. 2007;1773:642–652. - PMC - PubMed
    1. Mouneimne G, et al. Spatial and temporal control of cofilin activity is required for directional sensing during chemotaxis. Curr Biol. 2006;16:2193–2205. - PubMed
    1. Sinha P, et al. Increased expression of epidermal fatty acid binding protein, cofilin, and 14-3-3-sigma (stratifin) detected by two-dimensional gel electrophoresis, mass spectrometry and microsequencing of drug-resistant human adenocarcinoma of the pancreas. Electrophoresis. 1999;20:2952–2960. - PubMed

Publication types

MeSH terms