. 2009 May;12(5):553-8.
doi: 10.1038/nn.2295. Epub 2009 Mar 29.

Localization of inner hair cell mechanotransducer channels using high-speed calcium imaging

Affiliations

Localization of inner hair cell mechanotransducer channels using high-speed calcium imaging

Maryline Beurg et al. Nat Neurosci. 2009 May.

Abstract

Hair cells detect vibrations of their stereociliary bundle by activation of mechanically sensitive transducer channels. Although evidence suggests the transducer channels are near the stereociliary tops and are opened by force imparted by tip links connecting contiguous stereocilia, the exact channel site remains controversial. We used fast confocal imaging of fluorescence changes reflecting calcium entry during bundle stimulation to localize the channels. Calcium signals were visible in single stereocilia of rat cochlear inner hair cells and were up to tenfold larger and faster in the second and third stereociliary rows than in the tallest first row. The number of functional stereocilia was proportional to transducer current amplitude, indicating that there were about two channels per stereocilium. Comparable results were obtained in outer hair cells. The observations, supported by theoretical simulations, suggest there are no functional mechanically sensitive transducer channels in first row stereocilia and imply the channels are present only at the bottom of the tip links.


Figures

Figure 1
Figure 1
Amplitude and time course of stereociliary calcium signals. (a) Images of an inner hair cell stereociliary bundle in fluorescence at +100 mV and −80 mV holding potential and in brightfield illumination (bottom) with the focus at the top of the middle row stereocilia. Each bright spot at −80 mV corresponds to the fluorescence of the calcium indicator in a single stereocilium in row 2 (R2) or row 1 (R1). Images are averages of 10 individual frames taken at times denoted by the thick bars in (b). (b) Average changes in fluorescence in row 2 (R2) and row 1 (R1) in response to the pair of stimuli shown above. These correspond to a depolarization from −80 to +100 mV followed by a bundle deflection evoked by a water jet. In this and subsequent figures, the mechanical stimulus denotes the voltage pulse producing the water jet and the fluorescence traces have been zeroed, removing small difference in offset, to facilitate comparison of the traces. The calcium fluorescence developed after repolarization to −80 mV when the MT current is inward. R2 and R1 onsets have been fitted with single exponentials with time constants of 25 ms and 77 ms respectively. At the bottom are superimposed traces of the time course of the fluorescence changes in 14 individual bright R2 stereocilia (R2 bright) and two dark stereocilia (R2 dark) that are indicated by white lines in fluorescence images and dark lines in the brightfield image. Fluorescence intensity expressed in arbitrary units. Calcium indicator, 1mM Fluo-4FF; peak MT current, 760 pA.
Figure 2
Figure 2
Amplitude and time course of stereociliary calcium signals of an inner hair cell bundle tilted to show all three stereociliary rows. (a) Average fluorescence and Nomarski images. The bright R3 stereocilia (black) have neighboring bright R2 stereocilia (red) but two bright R3 stereocilia (purple) have no corresponding bright R2 stereocilia. (b) Time course of the fluorescence changes (bottom) for the stereociliary groups in (a): R1 (pink), active R2 (red), non-active R2 (blue), active R3 with a contiguous active R2 (black), active R3 without an active R2 (purple). Fluorescence intensity expressed in arbitrary units. Calcium indicator, 1mM Fluo-4FF; peak MT current 900 pA (c, d).
Figure 3
Figure 3
Variation in calcium signal along the stereocilia. (a) Transverse images of an inner hair cell bundle at the top, middle and base at +100 mV (left) and −80 mV (right). Each image is the average of ten frames taken at times indicated by black bars in (c). (b) Schematic of the bundle showing three focal planes at which images in (a) were taken. (c) Time course of calcium signals in row 2 and row 1 stereocilia in response to the pair of stimuli shown above. These correspond to a depolarization from −80 to +100 mV followed by a bundle deflection elicited by a water jet that produces a membrane current depicted in third trace. The three focal planes were taken in three consecutive presentations and the current responses in each are superimposed. Note that for row 2, the fluorescence change is larger and faster for the middle (red) than for the bottom (blue) of the bundle. For row 1, the fluorescence change is largest at the bottom (blue) and smaller and slower at the middle (red) and top (black) of the bundle. 1mM Fluo4 calcium indicator plus 50 μM AlexaFluor 488 to counter stain all stereocilia. Peak MT current, 740 pA.
Figure 4
Figure 4
Relationship between number of active stereocilia and MT current amplitude. (a) Images of three cells showing different numbers of bright fluorescent (active) stereocilia during mechanical stimulation that evoked different MT current amplitudes which are given on the images. In all examples it is possible to see both row 2 and row 3 stereocilia as well as row 1 in the top two images. (b) Plot of MT current against number of (bright) active stereocilia measured in 52 different inner hair cells. Line is a fit through the origin with slope 35.4 ± 1.3 pA/stereocilium, regression coefficient 0.87.
Figure 5
Figure 5
Amplitude and time course of stereociliary calcium signals in an outer hair cell. (a) Transverse images of an outer hair cell bundle at the middle and base of the bundle, each image being the average of ten frames taken at times indicated by black bars in (b). The positions of the three rows, R1, R2 and R3 are indicated on the image. (b) Time course of calcium signals in row 1, row 2 and row 3 stereocilia in response to the stimuli shown above, a depolarization from −80 to +80 mV followed by a bundle deflection elicited by a water jet. The membrane current responses for each of the two focal planes are superimposed in third trace. Note that for row 2 (R2) and row 3 (R3), the fluorescence change is larger at the middle than at the base of the bundle whereas for row 1 (R1), the fluorescence change is largest at the base and smaller at the middle. Dashed lines superimposed on the fluorescence onsets at the middle are single exponentials fits with time constants of 116 ms (R1), 19 ms (R2) and 16 ms (R3). 1 mM Fluo4 calcium indicator plus 50 μM AlexaFluor 488 to counter stain all stereocilia. Peak MT current, 520 pA.
Figure 6
Figure 6
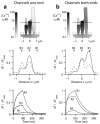
Theoretical distributions of calcium and Fluo-4FF fluorescence for two different channel locations. (a) Two MT channels (triangles) located at the tops of R2 and R3 stereocilia. The cartoon of the inner hair cell bundle shows the gradients in calcium concentration 80 ms after opening of the MT channels as in the experiments. In the middle traces, the distributions of Fluo-4FF fluorescence within the confocal volume are shown for the two focal planes indicated as dashed lines in cartoon, at the middle and at the base of the bundle. The simulations incorporated the axial and lateral resolutions of the confocal system indicated as FWHM by the green ellipse superimposed on the R3 stereocilium. Although the middle focal plane is above the top of the R3 stereocilia, there is still an R3 signal because the axial resolution is 1.1 μm FWHM, but this is smaller than at the base because much of the confocal volume is outside the R3 stereocilium. At the middle focal plane, the R2 calcium fluorescence is about 15 times larger than R1 and 3 times larger than R3. The time courses of the changes in fluorescence, scaled to the maximum occurring in the bundle are shown at the bottom for R1, R2 and R3. Dashed lines double exponential fits to onsets with time constants: τ1 = 120 ms (R1); τ1 = 10 ms, τ2 = 70 ms (R2; fast component 0.6); and τ1 = 8 ms, τ2 = 35 ms (R3, fast component 0.55). (b) Two MT channels placed at either end of the tip link. The fluorescence in R1 is larger than in R2 which is larger than in R3. Time course of fluorescence change for channels at either end of tip link. The distributions of fluorescence for channels at lower end of tip links (a) most closely resemble those observed experimentally. See Methods for details of the model.
Figure 7
Figure 7

Comment in

References

    1. Fettiplace R, Ricci AJ. Mechanoelectrical transduction in auditory hair cells. In: Eatock RA, Popper A, Fay RR, editors. Springer Handbook of Auditory Research: Hair Cells. Springer; Germany: 2006. pp. 154–203.
    1. Hudspeth AJ. Extracellular current flow and the site of transduction by vertebrate hair cells. J Neurosci. 1982;2:1–10. - PMC - PubMed
    1. Jaramillo F, Hudspeth AJ. Localization of the hair cell's transduction channels at the hair bundle's top by iontophoretic application of a channel blocker. Neuron. 1991;7:409–420. - PubMed
    1. Lumpkin EA, Hudspeth AJ. Detection of Ca2+ entry through mechanosensitive channels localizes the site of mechanoelectrical transduction in hair cells. Proc Natl Acad Sci U S A. 1995;92:10297–10301. - PMC - PubMed
    1. Denk W, Holt JR, Shepherd GM, Corey DP. Calcium imaging of single stereocilia in hair cells: localization of transduction channels at both ends of tip links. Neuron. 1995;15:1311–1321. - PubMed

Publication types

MeSH terms