A multistage genome-wide association study in breast cancer identifies two new risk alleles at 1p11.2 and 14q24.1 (RAD51L1)
- PMID: 19330030
- PMCID: PMC2928646
- DOI: 10.1038/ng.353
A multistage genome-wide association study in breast cancer identifies two new risk alleles at 1p11.2 and 14q24.1 (RAD51L1)
Abstract
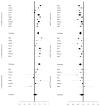
We conducted a three-stage genome-wide association study (GWAS) of breast cancer in 9,770 cases and 10,799 controls in the Cancer Genetic Markers of Susceptibility (CGEMS) initiative. In stage 1, we genotyped 528,173 SNPs in 1,145 cases of invasive breast cancer and 1,142 controls. In stage 2, we analyzed 24,909 top SNPs in 4,547 cases and 4,434 controls. In stage 3, we investigated 21 loci in 4,078 cases and 5,223 controls. Two new loci achieved genome-wide significance. A pericentromeric SNP on chromosome 1p11.2 (rs11249433; P = 6.74 x 10(-10) adjusted genotype test, 2 degrees of freedom) resides in a large linkage disequilibrium block neighboring NOTCH2 and FCGR1B; this signal was stronger for estrogen-receptor-positive tumors. A second SNP on chromosome 14q24.1 (rs999737; P = 1.74 x 10(-7)) localizes to RAD51L1, a gene in the homologous recombination DNA repair pathway. We also confirmed associations with loci on chromosomes 2q35, 5p12, 5q11.2, 8q24, 10q26 and 16q12.1.
Figures


References
-
- Colditz GA, Baer HJ, Tamimi RM. Breast Cancer. In: David S, Fraumeni JF, editors. Cancer Epidemiology and Prevention. Oxford University Press; New York, USA: 2006. pp. 995–1012.
-
- Miki Y. A strong candidate for the breast and ovarian-cancer susceptibility gene BRCA1. Science. 1994;266:66–71. - PubMed
-
- Wooster R. Identification of the breast cancer susceptibility gene BRCA2. Nature. 1995;378:789–792. - PubMed
-
- Meijers-Heijboer H. Low-penetrance susceptibility to breast cancer due to CHEK2*1100delC in noncarriers of BRCA1 or BRCA2 mutations. Nature Genet. 2002;31:55–59. - PubMed
Publication types
MeSH terms
Substances
Grants and funding
- R01 CA050385/CA/NCI NIH HHS/United States
- 5UO1CA098233/CA/NCI NIH HHS/United States
- P01 CA087969/CA/NCI NIH HHS/United States
- R01 CA067262/CA/NCI NIH HHS/United States
- CA87969/CA/NCI NIH HHS/United States
- CA49449/CA/NCI NIH HHS/United States
- CA67262/CA/NCI NIH HHS/United States
- U01 CA049449/CA/NCI NIH HHS/United States
- U01 CA067262/CA/NCI NIH HHS/United States
- R01 CA065725/CA/NCI NIH HHS/United States
- U01 CA098233/CA/NCI NIH HHS/United States
- ImNIH/Intramural NIH HHS/United States
- R01 CA049449/CA/NCI NIH HHS/United States
- UO1 CA098710/CA/NCI NIH HHS/United States
- CA50385/CA/NCI NIH HHS/United States
- U01 CA098710/CA/NCI NIH HHS/United States
- CA65725/CA/NCI NIH HHS/United States
LinkOut - more resources
Full Text Sources
Other Literature Sources
Medical
Molecular Biology Databases
Miscellaneous

