

An improved cell-penetrating, caspase-activatable, near-infrared fluorescent peptide for apoptosis imaging
- PMID: 19331388
- PMCID: PMC2672423
- DOI: 10.1021/bc800516n
An improved cell-penetrating, caspase-activatable, near-infrared fluorescent peptide for apoptosis imaging
Abstract
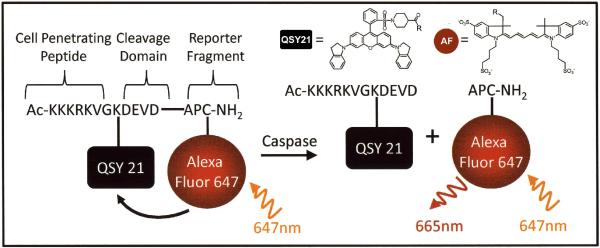
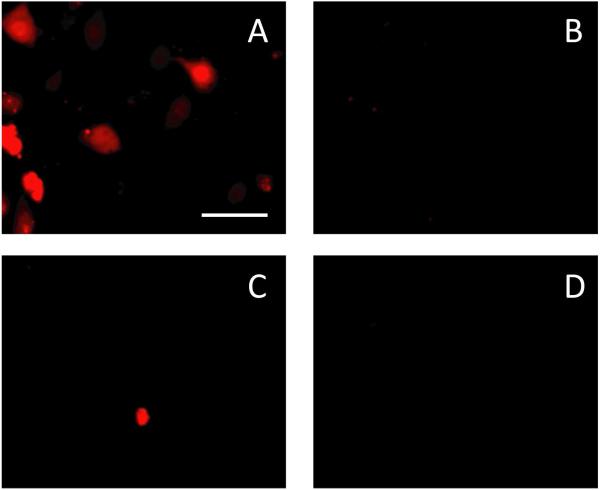
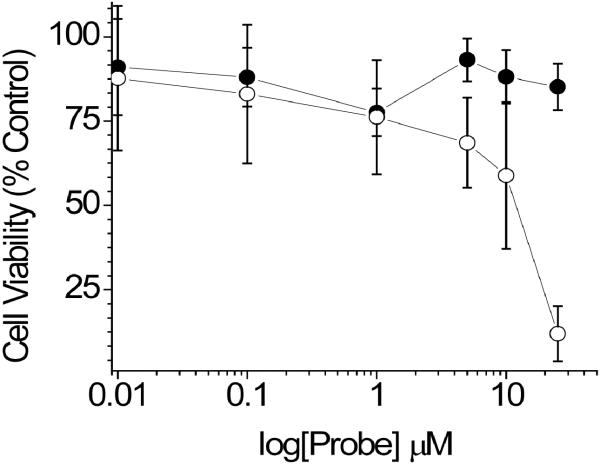
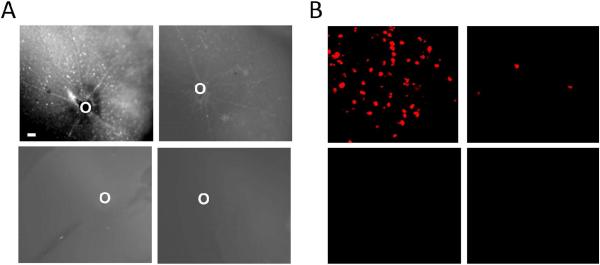
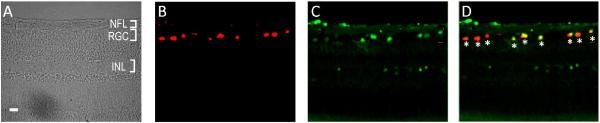
Apoptosis is required for normal cellular homeostasis, and deregulation of the apoptotic process is implicated in various diseases. Previously, we developed a cell-penetrating near-infrared fluorescence (NIRF) probe based on an activatable strategy to detect apoptosis-associated caspase activity in vivo. This probe consisted of a cell-penetrating Tat peptide conjugated to an effector recognition sequence (DEVD) that was flanked by a fluorophore-quencher pair (Alexa Fluor 647 and QSY 21). Once exposed to effector caspases, the recognition sequence was cleaved, resulting in separation of the fluorophore-quencher pair and signal generation. Herein, we present biochemical analysis of a second generation probe, KcapQ, with a modified cell-penetrating peptide sequence (KKKRKV). This modification resulted in a probe that was more sensitive to effector caspase enzymes, displayed an unexpectedly higher quenching efficiency between the fluorophore-quencher pair, and was potentially less toxic to cells. Assays using recombinant caspase enzymes revealed that the probe was specific for effector caspases (caspase 3 > 7 > 6). Analysis of apoptosis in HeLa cells treated with doxorubicin showed probe activation specific to apoptotic cells. In a rat model of retinal neuronal excitotoxicity, intravitreal injection of N-methyl-d-aspartate (NMDA) induced apoptosis of retinal ganglion cells (RGCs). Eyecup and retinal flat-mount images of NMDA-pretreated animals injected intravitreally with KcapQ using a clinically applicable protocol showed specific and widely distributed cell-associated fluorescence signals compared to untreated control animals. Fluorescence microscopy images of vertical retinal sections from NMDA-pretreated animals confirmed that activated probe was predominantly localized to RGCs and colocalized with TUNEL labeling. Thus, KcapQ represents an improved effector caspase-activatable NIRF probe for enhanced noninvasive analysis of apoptosis in whole cells and live animals.
Figures
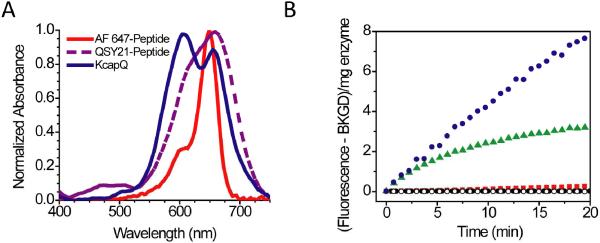
 caspase 3;
  caspase 7;
  caspase 6; ● caspase 9; ○ D-KcapQ). Assays with effector caspases resulted in KcapQ activation, whereas assays with initiator caspases showed no proteolytic activity towards KcapQ.
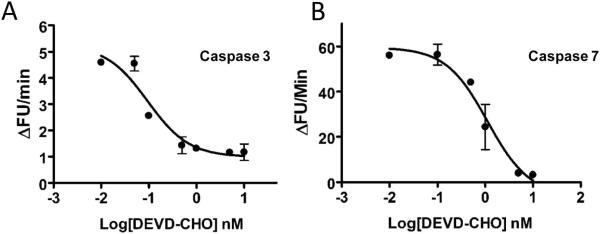
Similar articles
-
Single-cell resolution imaging of retinal ganglion cell apoptosis in vivo using a cell-penetrating caspase-activatable peptide probe.PLoS One. 2014 Feb 21;9(2):e88855. doi: 10.1371/journal.pone.0088855. eCollection 2014. PLoS One. 2014. PMID: 24586415 Free PMC article.
-
Ac-rkkrrorrrGK(QSY21)DEVDAPC(Alexa Fluor 647)-NH2.2008 Jan 23 [updated 2008 Apr 22]. In: Molecular Imaging and Contrast Agent Database (MICAD) [Internet]. Bethesda (MD): National Center for Biotechnology Information (US); 2004–2013. 2008 Jan 23 [updated 2008 Apr 22]. In: Molecular Imaging and Contrast Agent Database (MICAD) [Internet]. Bethesda (MD): National Center for Biotechnology Information (US); 2004–2013. PMID: 20641692 Free Books & Documents. Review.
-
Synthesis and characterization of a small, membrane-permeant, caspase-activatable far-red fluorescent peptide for imaging apoptosis.J Med Chem. 2005 Aug 25;48(17):5404-7. doi: 10.1021/jm050008p. J Med Chem. 2005. PMID: 16107137
-
Single-cell imaging of retinal ganglion cell apoptosis with a cell-penetrating, activatable peptide probe in an in vivo glaucoma model.Proc Natl Acad Sci U S A. 2009 Jun 9;106(23):9391-6. doi: 10.1073/pnas.0812884106. Epub 2009 May 20. Proc Natl Acad Sci U S A. 2009. PMID: 19458250 Free PMC article.
-
Cy5-Tat-Glu-Pro-Asp-acyloxymethyl ketone.2010 May 19 [updated 2010 Jun 3]. In: Molecular Imaging and Contrast Agent Database (MICAD) [Internet]. Bethesda (MD): National Center for Biotechnology Information (US); 2004–2013. 2010 May 19 [updated 2010 Jun 3]. In: Molecular Imaging and Contrast Agent Database (MICAD) [Internet]. Bethesda (MD): National Center for Biotechnology Information (US); 2004–2013. PMID: 20642015 Free Books & Documents. Review.
Cited by
-
Reporter nanoparticle that monitors its anticancer efficacy in real time.Proc Natl Acad Sci U S A. 2016 Apr 12;113(15):E2104-13. doi: 10.1073/pnas.1603455113. Epub 2016 Mar 29. Proc Natl Acad Sci U S A. 2016. PMID: 27036008 Free PMC article.
-
Stimuli-responsive linkers and their application in molecular imaging.Exploration (Beijing). 2024 Jan 18;4(4):20230027. doi: 10.1002/EXP.20230027. eCollection 2024 Aug. Exploration (Beijing). 2024. PMID: 39175888 Free PMC article. Review.
-
Protonation and Trapping of a Small pH-Sensitive Near-Infrared Fluorescent Molecule in the Acidic Tumor Environment Delineate Diverse Tumors in Vivo.Mol Pharm. 2015 Dec 7;12(12):4237-46. doi: 10.1021/acs.molpharmaceut.5b00430. Epub 2015 Nov 4. Mol Pharm. 2015. PMID: 26488921 Free PMC article.
-
Activatable molecular probes for cancer imaging.Curr Top Med Chem. 2010;10(11):1135-44. doi: 10.2174/156802610791384270. Curr Top Med Chem. 2010. PMID: 20388112 Free PMC article. Review.
-
Ultra-pH-sensitive nanoprobe library with broad pH tunability and fluorescence emissions.J Am Chem Soc. 2014 Aug 6;136(31):11085-92. doi: 10.1021/ja5053158. Epub 2014 Jul 29. J Am Chem Soc. 2014. PMID: 25020134 Free PMC article.
References
-
- Grutter M. Caspases: key players in programmed cell death. Curr Opin Struct Biol. 2000;10:649–655. - PubMed
-
- Shi Y. A structural view of mitochondria-mediated apoptosis. Nature Structural Biology. 2001;8:394–401. - PubMed
-
- Kroemer G, Martin S. Caspase-independent cell death. Nat Med. 2005;11:725–730. - PubMed
-
- Ran S, Thorpe PE. Phosphatidylserine is a marker of tumor vasculature and a potential target for cancer imaging and therapy. Int J Radiat Oncol Biol Phys. 2002;54:1479–1484. - PubMed
Publication types
MeSH terms
Substances
Grants and funding
LinkOut - more resources
Full Text Sources
Other Literature Sources
Research Materials
