Comparative Study
. 2009 Apr;35(2):424-438.
doi: 10.1037/a0013894.

The roles of altitude and fear in the perception of height

Affiliations
Comparative Study

The roles of altitude and fear in the perception of height

Jeanine K Stefanucci et al. J Exp Psychol Hum Percept Perform. 2009 Apr.

Abstract

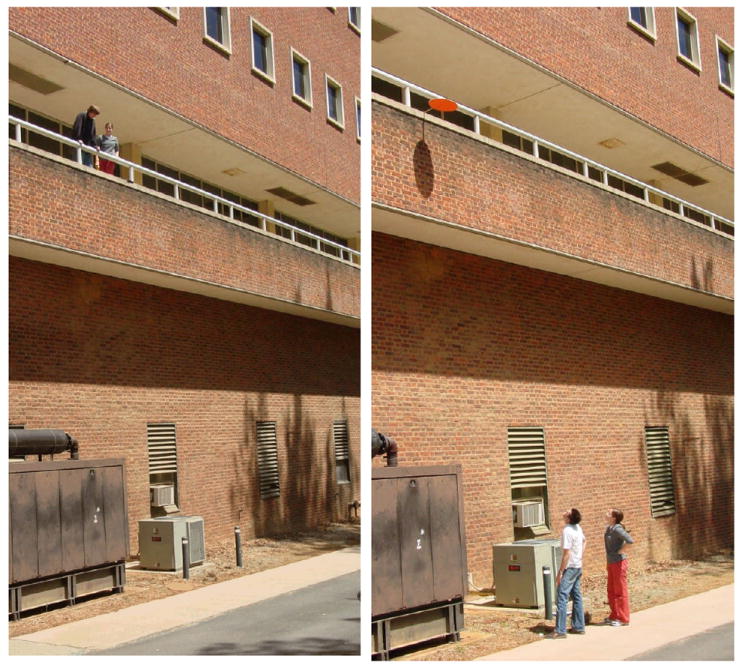
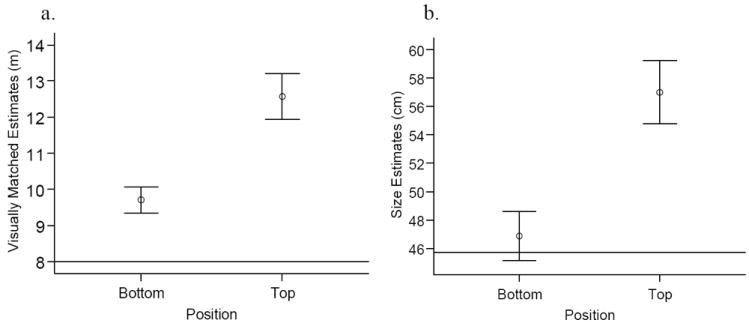
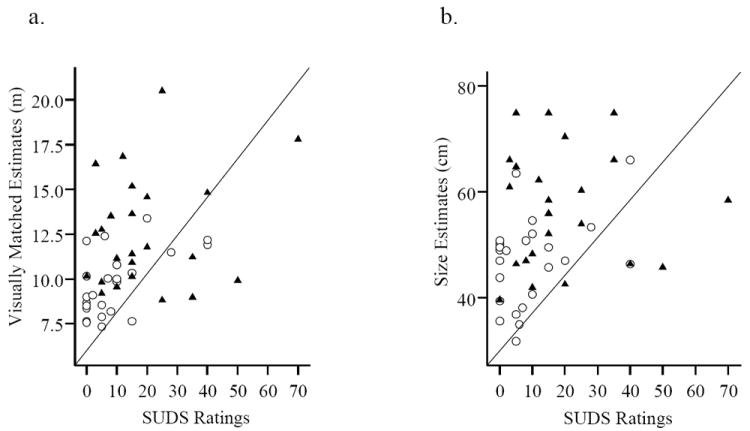
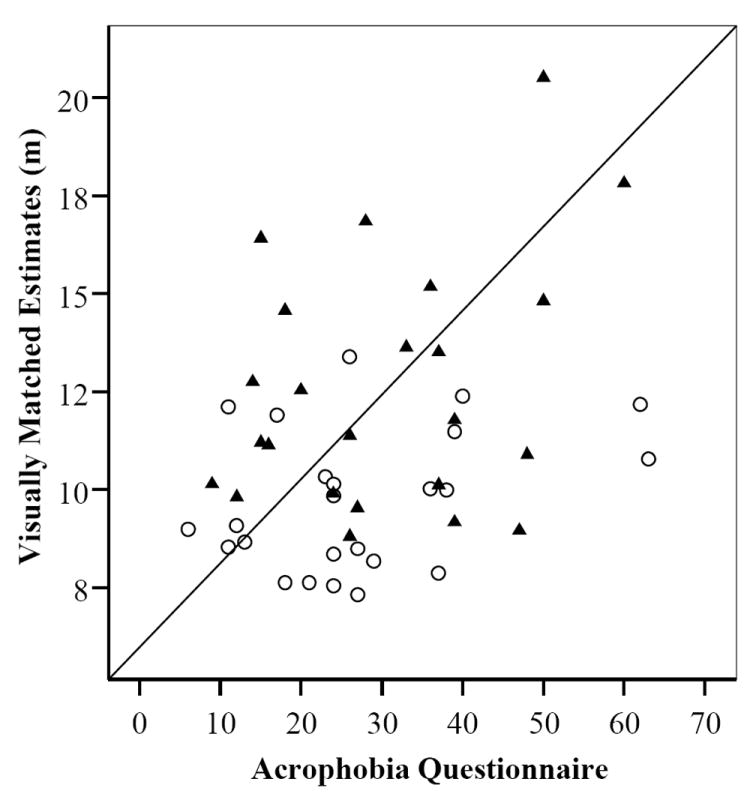
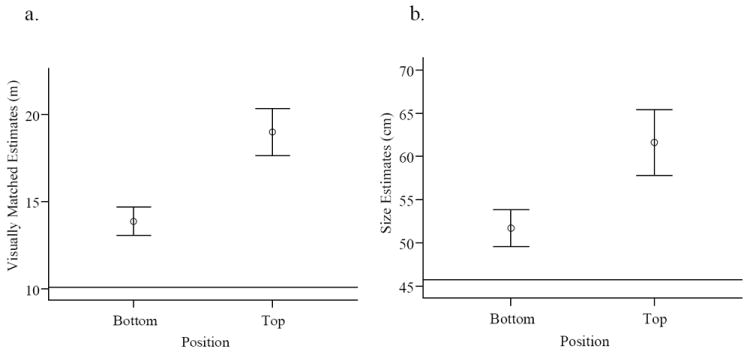
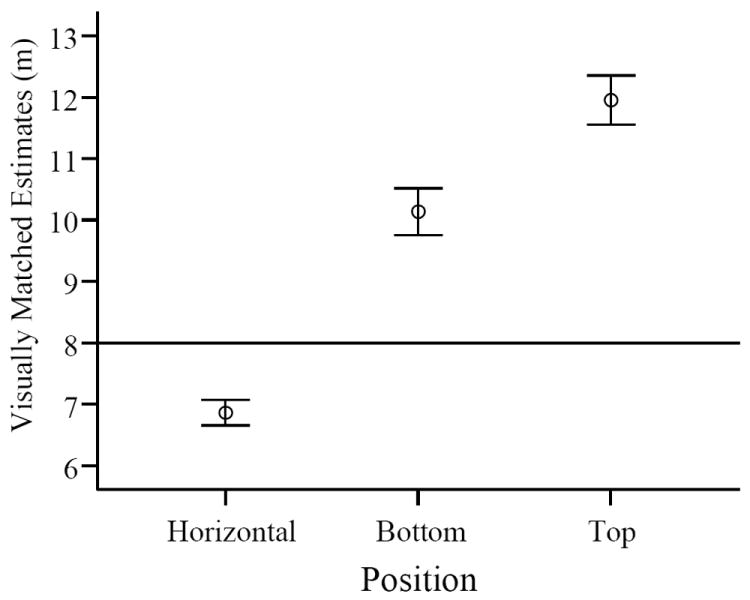
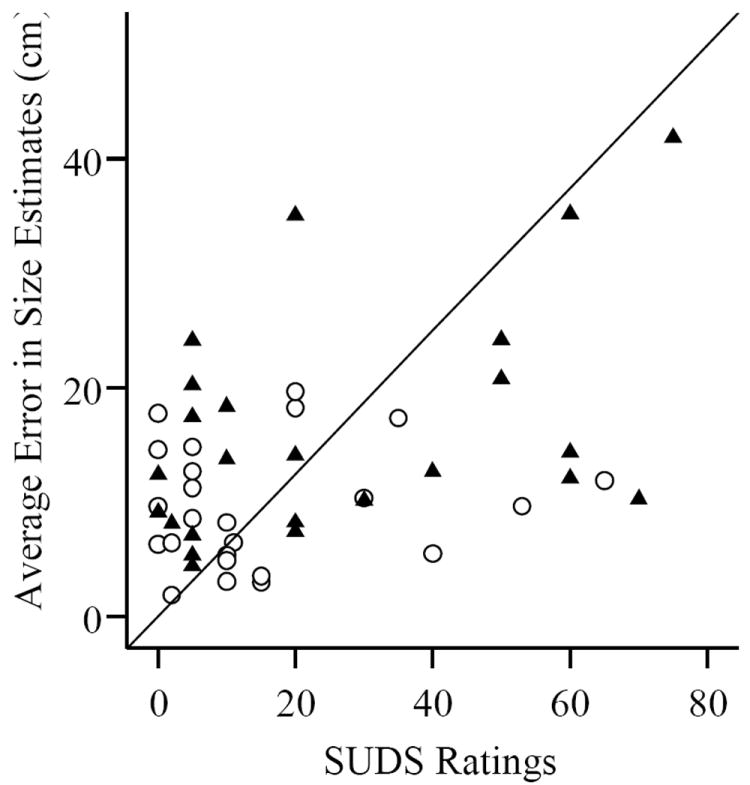
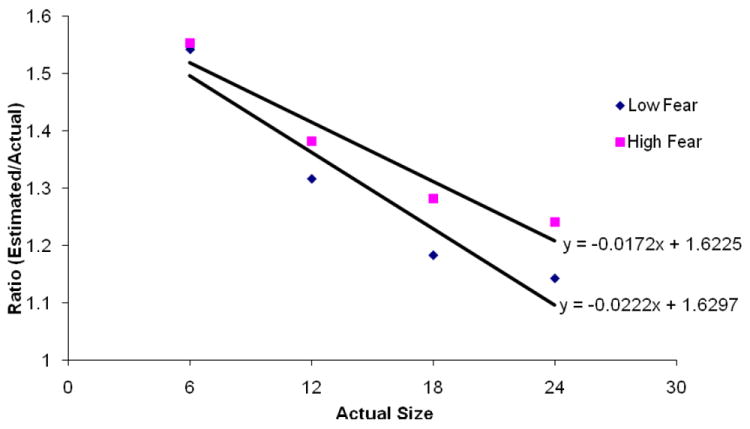
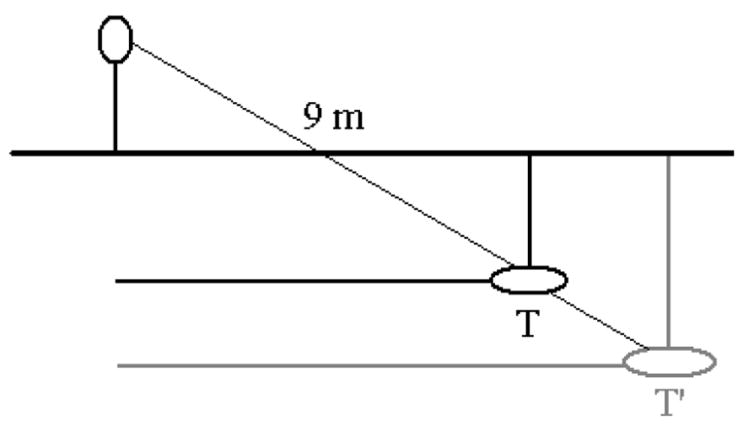
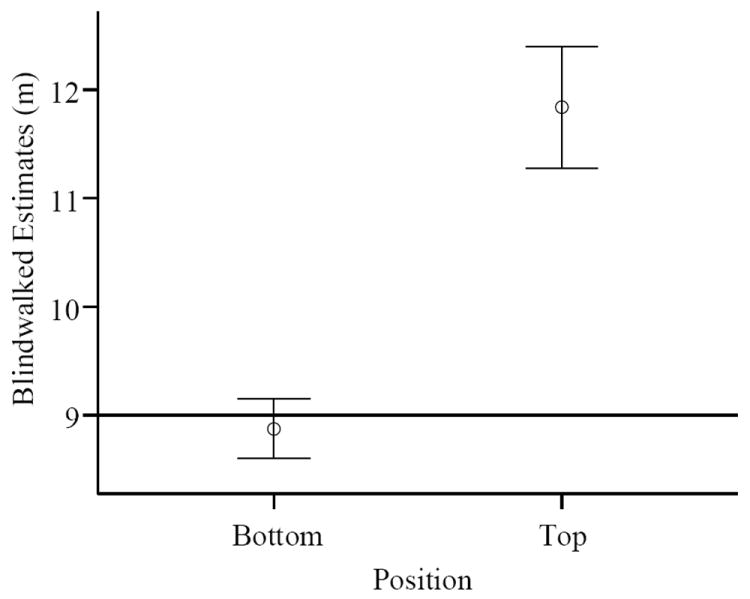
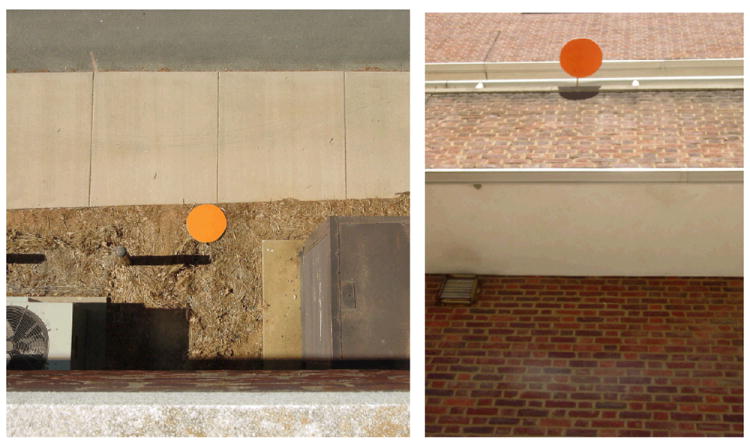
Previous research on perceiving spatial layout has found that people often exhibit normative biases in their perception of the environment. For instance, slant is typically overestimated and distance is usually underestimated. Surprisingly, however, the perception of height has rarely been studied. The present experiments examined the perception of height when viewed from the top (e.g., looking down) or from the bottom (e.g., looking up). Multiple measures were adapted from previous studies of horizontal extents to assess the perception of height. Across all of the measures, a large, consistent bias was found: Vertical distances were greatly overestimated, especially from the top. Secondary findings suggest that the overestimation of distance and size that occurs when looking down from a high place correlates with reports of trait- and state-level fear of heights, suggesting that height overestimation may be due, in part, to fear.


Figures

Figure 1
Figure 1
Viewing locations for the top (left) and bottom (right) viewing conditions in Experiments 1a and 2.
Figure 2
Figure 2
a) Height estimates for the top and bottom viewing conditions in Experiment 1a. The line denotes the actual height of the balcony (8m). b) Size estimates for the top and bottom viewing conditions in Experiment 1a. The line denotes the actual size of the target (45.72cm). All bars represent 1 standard error of the mean.
Figure 3
Figure 3
a) Relationship between height estimates (m) and state-level fear ratings (SUDS) in Experiment 1a. b) Relationship between size estimates (cm) and state-level fear ratings (SUDS) in Experiment 1a. In both graphs, the triangles represent participants who viewed the balcony from the top and the circles represent participants who viewed the balcony from the bottom.
Figure 4
Figure 4
Relationship between height estimates (m) and trait-level fear ratings (AQ) for for the top (triangles) and bottom (circles) viewing conditions of Experiment 1a.
Figure 5
Figure 5
a) Height estimates for the top and bottom viewing conditions in Experiment 1c. The line denotes the actual height of the balcony (~ 10m). b) Size estimates for the top and bottom viewing conditions in Experiment 1c. The line denotes the actual size of the target (45.72cm). All bars represent 1 standard error of the mean.
Figure 6
Figure 6
Height estimates for the horizontal, bottom and top viewing conditions in Experiment 2. The line denotes the actual distance to the target (8m). The bars represent 1 standard error of the mean.
Figure 7
Figure 7
Relationship between the average error in size estimates (cm) and state-level ratings of fear (SUDS) for the top (triangles) and bottom (circles) viewing conditions of Experiment 2.
Figure 8
Figure 8
Mean values for each condition are shown by actual size and the ratio of perceived to actual size. Slope and intercept parameters were computed from the entire set of data using LMM.
Figure 9
Figure 9
Diagram of the placement of the target disk (T) relative to the observer in Experiment 4. T’ represents the perceived location of the target when the distance to the target is overestimated. Therefore, when participants are asked to walk to a location directly above the target, they should walk further if they are overestimating distance (stopping over T’ instead of over T).
Figure 10
Figure 10
Blindwalked estimates of distance for the top and bottom viewing conditions in Experiment 4. The line denotes the actual distance to the target (9m). The bars represent 1 standard error of the mean.
Figure 11
Figure 11
View of the target disk from the top and bottom. Texture gradient is more apparent from the bottom than the top (e.g., the bricks).

Similar articles

Cited by

References

    1. Amorim M-A, Loomis JM, Fukusima SS. Reproduction of object shape is more accurate without the continued availability of visual information. Perception. 1998;27:69–86. - PubMed
    1. Andre J, Rogers S. Using verbal and blind-walking distance estimates to investigate the two-visual systems hypothesis. Perception & Psychophysics. in press. - PubMed
    1. Bhalla M, Proffitt DR. Visual-Motor Recalibration in Geographical Slant Perception. Journal of Experimental Psychology: Human Perception and Performance. 1999;25(4):1–21. - PubMed
    1. Bolles RC, Bailey DE. Importance of object recognition in size constancy. Journal of Experimental Psychology. 1956;51:222–225. - PubMed
    1. Bouchard S, St-Jacques J, Robillard G, Cote S, Renaud P. Efficacy of a virtual reality exposure treatment for acrophobia: A preliminary study. Journal de Therapie Comportementale et Cognitive. 2003;13:107–112.

Publication types