

doi: 10.3201/eid1504.080822.
Links between climate, malaria, and wetlands in the Amazon Basin
Affiliations
- PMID: 19331766
- PMCID: PMC2671454
- DOI: 10.3201/eid1504.080822
Item in Clipboard
Links between climate, malaria, and wetlands in the Amazon Basin
Emerg Infect Dis.
2009 Apr.
Abstract
Climate changes are altering patterns of temperature and precipitation, potentially affecting regions of malaria transmission. We show that areas of the Amazon Basin with few wetlands show a variable relationship between precipitation and malaria, while areas with extensive wetlands show a negative relationship with malaria incidence.
Figures
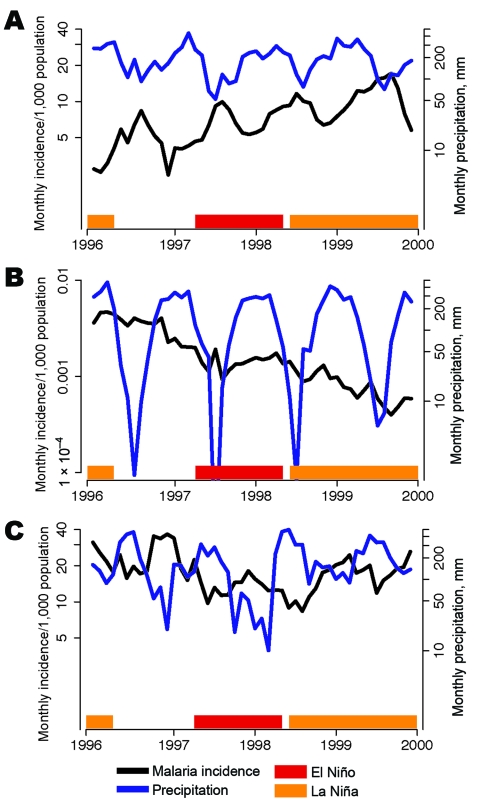
Malaria incidence per 1,000 population (black lines) and mean monthly precipitation (blue lines) during La Niña (orange bars) and El Niño (red bars) events for the states of A) Amazonas, B) Mato Grosso, and C) Roraima.

Connection of malaria incidence and precipitation risk ratios to wetlands. A) Percentage of wetlands in Amazon Basin counties (shades of blue), counties without wetlands data (yellow), and counties with <80 total malaria cases (gray). Wetland colors correspond to percentage wetland values in panel D. B) Risk ratios for malaria incidence for 1 SD (≈14 cm) change in monthly precipitation (January 1996–December 1999), plotted at each county seat of government; C) spatially smoothed risk ratios for ≈14-cm changes in monthly precipitation. In both panels, red shaded squares show reduced risk for ≈14-cm increase in monthly precipitation; blue shaded squares show increased risk for malaria with increased precipitation. D) Boxplot of risk ratios for malaria incidence for ≈14-cm changes in monthly precipitation, by percentage wetland cover. Box width is proportional to the number of counties in each box. Error bars indicate interquartile ranges, and thick horizontal bars indicate the median.
References
-
- Millennium Ecosystem Assessment. Ecosystems and human well-being: synthesis. Washington: Island Press; 2005.
-
- Gil LH, Tada MS, Katsuragawa TH, Ribolla PE, da Silva LH. Urban and suburban malaria in Rondonia (Brazilian Western Amazon) II. Perennial transmissions with high anopheline densities are associated with human environmental changes. Mem Inst Oswaldo Cruz. 2007;102:271–6. 10.1590/S0074-02762007005000013 - DOI - PubMed
Publication types
MeSH terms
LinkOut - more resources
Full Text Sources
Medical