

Inference of cell cycle-dependent proteolysis by laser scanning cytometry
- PMID: 19331831
- PMCID: PMC2680938
- DOI: 10.1016/j.yexcr.2009.01.011
Inference of cell cycle-dependent proteolysis by laser scanning cytometry
Abstract
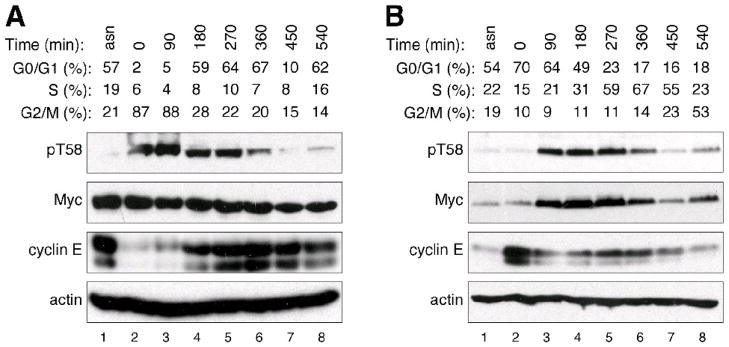
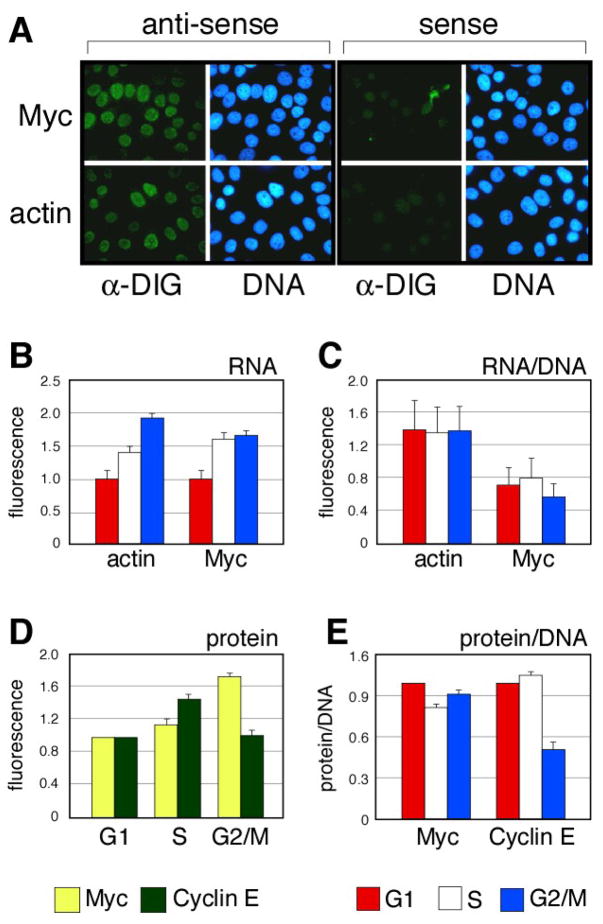
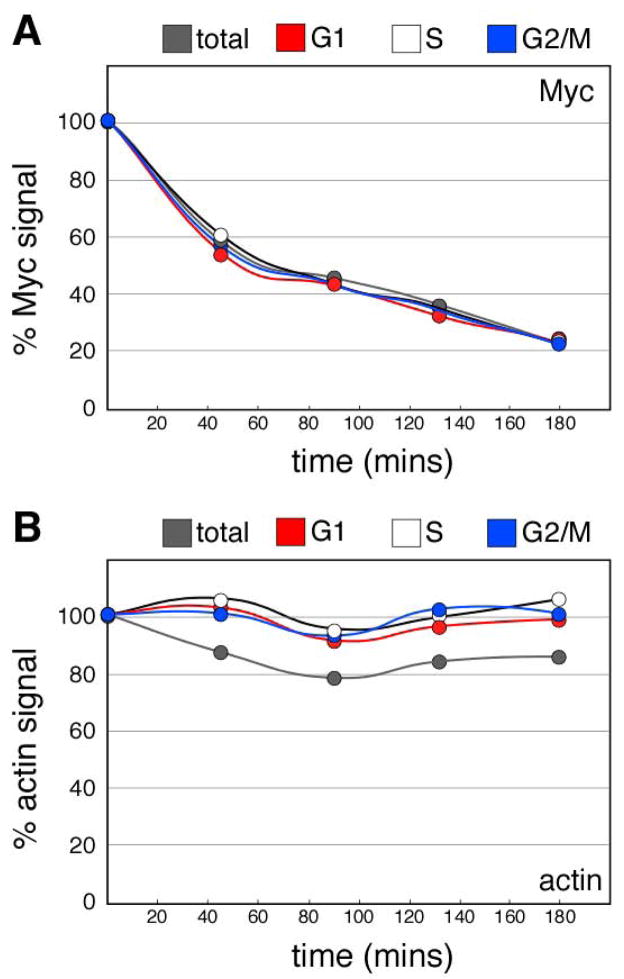
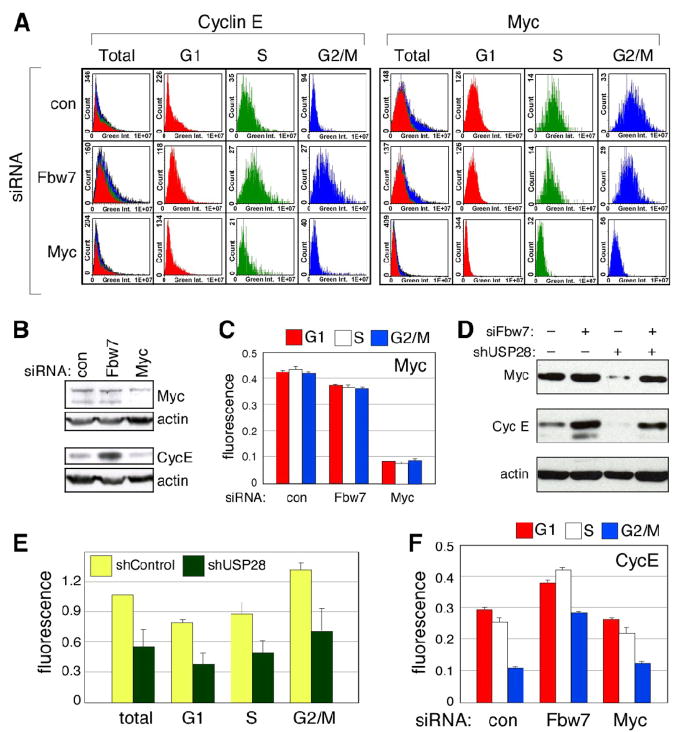
Mechanisms that couple protein turnover to cell cycle progression are critical for coordinating the events of cell duplication and division. Despite the importance of cell cycle-regulated proteolysis, however, technologies to measure this phenomenon are limited, and typically involve monitoring cells that are released back into the cell cycle after synchronization. We describe here the use of laser scanning cytometry (LSC), a technical merger between fluorescence microscopy and flow cytometry, to determine cell cycle-dependent changes in protein stability in unperturbed, asynchronous, cultures of mammalian cells. In this method, the ability of the LSC to accurately measure whole cell fluorescence is employed, together with RNA fluorescence in situ hybridization and immunofluorescence, to relate abundance of a particular RNA and protein in a cell to its point at the cell cycle. Parallel monitoring of RNA and protein levels is used, together with protein synthesis inhibitors, to reveal cell cycle-specific changes in protein turnover. We demonstrate the viability of this method by analyzing the proteolysis of two prominent human oncoproteins, Myc and Cyclin E, and argue that this LSC-based approach offers several practical advantages over traditional cell synchronization methods.
Figures
Similar articles
-
Ampelopsin induces apoptosis by regulating multiple c-Myc/S-phase kinase-associated protein 2/F-box and WD repeat-containing protein 7/histone deacetylase 2 pathways in human lung adenocarcinoma cells.Mol Med Rep. 2015 Jan;11(1):105-12. doi: 10.3892/mmr.2014.2733. Epub 2014 Oct 21. Mol Med Rep. 2015. PMID: 25333250 Free PMC article.
-
Recombinant human adenovirus-p53 injection induced apoptosis in hepatocellular carcinoma cell lines mediated by p53-Fbxw7 pathway, which controls c-Myc and cyclin E.PLoS One. 2013 Jul 1;8(7):e68574. doi: 10.1371/journal.pone.0068574. Print 2013. PLoS One. 2013. Retraction in: PLoS One. 2020 Mar 27;15(3):e0231287. doi: 10.1371/journal.pone.0231287. PMID: 23840897 Free PMC article. Retracted.
-
Isoform- and cell cycle-dependent substrate degradation by the Fbw7 ubiquitin ligase.J Cell Biol. 2008 Jun 16;181(6):913-20. doi: 10.1083/jcb.200802076. J Cell Biol. 2008. PMID: 18559665 Free PMC article.
-
Regulation mechanism of Fbxw7-related signaling pathways (Review).Oncol Rep. 2015 Nov;34(5):2215-24. doi: 10.3892/or.2015.4227. Epub 2015 Aug 26. Oncol Rep. 2015. PMID: 26324296 Review.
-
Ratchets and clocks: the cell cycle, ubiquitylation and protein turnover.Nat Rev Mol Cell Biol. 2003 Nov;4(11):855-64. doi: 10.1038/nrm1246. Nat Rev Mol Cell Biol. 2003. PMID: 14625536 Review. No abstract available.
Cited by
-
DNA polymerase POLD1 promotes proliferation and metastasis of bladder cancer by stabilizing MYC.Nat Commun. 2023 Apr 27;14(1):2421. doi: 10.1038/s41467-023-38160-x. Nat Commun. 2023. PMID: 37105989 Free PMC article.
-
Ubiquitylation of the amino terminus of Myc by SCF(β-TrCP) antagonizes SCF(Fbw7)-mediated turnover.Nat Cell Biol. 2010 Oct;12(10):973-81. doi: 10.1038/ncb2104. Epub 2010 Sep 19. Nat Cell Biol. 2010. PMID: 20852628
-
Target gene-independent functions of MYC oncoproteins.Nat Rev Mol Cell Biol. 2020 May;21(5):255-267. doi: 10.1038/s41580-020-0215-2. Epub 2020 Feb 18. Nat Rev Mol Cell Biol. 2020. PMID: 32071436 Free PMC article. Review.
-
Laser scanning cytometry: principles and applications-an update.Methods Mol Biol. 2013;931:187-212. doi: 10.1007/978-1-62703-056-4_11. Methods Mol Biol. 2013. PMID: 23027005 Free PMC article. Review.
-
Analysis of cell cycle and replication of mouse macrophages after in vivo and in vitro Cryptococcus neoformans infection using laser scanning cytometry.Infect Immun. 2012 Apr;80(4):1467-78. doi: 10.1128/IAI.06332-11. Epub 2012 Jan 17. Infect Immun. 2012. PMID: 22252872 Free PMC article.
References
-
- Gong J, Traganos F, Darzynkiewicz Z. Growth imbalance and altered expression of cyclins B1, A, E, and D3 in MOLT-4 cells synchronized in the cell cycle by inhibitors of DNA replication. Cell Growth Differ. 1995;6:1485–1493. - PubMed
-
- Davis PK, Ho A, Dowdy SF. Biological methods for cell-cycle synchronization of mammalian cells. Biotechniques. 2001;30:1322–1326. 1328, 1330–1321. - PubMed
-
- Cooper S. Is whole-culture synchronization biology’s ‘perpetual-motion machine’? Trends Biotechnol. 2004;22:266–269. - PubMed
-
- Zickert P, Wejde J, Skog S, Zetterberg A, Larsson O. Growth-regulatory properties of G1 cells synchronized by centrifugal elutriation. Exp Cell Res. 1993;207:115–121. - PubMed
Publication types
MeSH terms
Substances
Grants and funding
LinkOut - more resources
Full Text Sources
