. 2009 Apr 14;106(15):6404-9.
doi: 10.1073/pnas.0810799106. Epub 2009 Mar 30.

Imaging the quantal substructure of single IP3R channel activity during Ca2+ puffs in intact mammalian cells

Affiliations

Imaging the quantal substructure of single IP3R channel activity during Ca2+ puffs in intact mammalian cells

Ian F Smith et al. Proc Natl Acad Sci U S A. .

Abstract

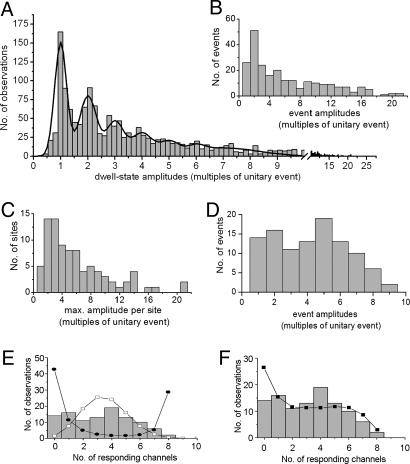
The spatiotemporal patterning of Ca(2+) signals regulates numerous cellular functions, and is determined by the functional properties and spatial clustering of inositol trisphosphate receptor (IP(3)R) Ca(2+) release channels in the endoplasmic reticulum membrane. However, studies at the single-channel level have been hampered because IP(3)Rs are inaccessible to patch-clamp recording in intact cells, and because excised organelle and bilayer reconstitution systems disrupt the Ca(2+)-induced Ca(2+) release (CICR) process that mediates channel-channel coordination. We introduce here the use of total internal reflection fluorescence microscopy to image single-channel Ca(2+) flux through individual and clustered IP(3)Rs in intact mammalian cells. This enables a quantal dissection of the local calcium puffs that constitute building blocks of cellular Ca(2+) signals, revealing stochastic recruitment of, on average, approximately 6 active IP(3)Rs clustered within <500 nm. Channel openings are rapidly ( approximately 10 ms) recruited by opening of an initial trigger channel, and a similarly rapid inhibitory process terminates puffs despite local [Ca(2+)] elevation that would otherwise sustain Ca(2+)-induced Ca(2+) release indefinitely. Minimally invasive, nano-scale Ca(2+) imaging provides a powerful tool for the functional study of intracellular Ca(2+) release channels while maintaining the native architecture and dynamic interactions essential for discrete and selective cell signaling.


Conflict of interest statement

The authors declare no conflict of interest.

Figures

Fig. 1.
Fig. 1.
Imaging IP3-evoked Ca2+ liberation with single-channel resolution. (A) Comparison of representative puffs recorded in SH-SY5Y cells following photo-release of i-IP3 using wide-field fluorescence microscopy (gray trace) and TIRF microscopy together with EGTA loading (black trace). Both traces show fluorescence ratio changes (ΔF/F0) averaged within 1 × 1 μm regions of interest centered on puff sites. (B) Representative image frames taken from a video sequence showing puffs evoked by photo-released iIP3 at different sites in 2 SH-SY5Y cells. Cell outlines (resting fluo-4 fluorescence) are shown in gray, and transient increases in [Ca2+]i are overlaid in red. (C) Graphical representation of puff activity evoked by photo-released iIP3 (arrow) at >70 sites. Ca2+ transients (puffs and blips) are represented on a pseudo-color scale (“warmer” colors indicate higher [Ca2+]) as indicated by the bar. Time runs from left to right and different puff sites are depicted vertically in random order.
Fig. 2.
Fig. 2.
Puff activity recorded in SH-SY5Y cells following photo-release of i-IP3 using TIRF microscopy. (A) Traces illustrate puffs evoked at 5 sites in different cells following flash photo-release of i-IP3 when marked by the arrow. (B) Examples of other sites that displayed exclusively single-channel activity. (C) Selected examples of puffs (taken from different sites and different cells) shown on an expanded time scale, illustrating step-wise transitions in Ca2+ fluorescence.
Fig. 3.
Fig. 3.
Ca2+ sources during different amplitude steps at a puff site localize within a few hundred nanometers. (A) Ca2+ signal from a 1-μm2 region of interest showing 5 discrete amplitude levels during a single puff. (B) Sequence of images showing the location of the Ca2+ fluorescence at times corresponding to the numbered levels in A. Each panel is an average of image frames captured during that step, and cross-hairs mark the centroid position of the fluorescence signal in the first frame. (C) Extended record showing multiple events at the same region of interest. The puff marked by the asterisk is that illustrated in A. (D) Scatter plot marks the centroid positions of Ca2+ signals during all (n = 53) step amplitude levels throughout the record in C, derived by fitting 2D Gaussian functions to averaged images like those in B. Square marks the region of interest from which the fluorescence traces in A and B were measured. The curve shows, on the same scale, the spatial distribution of fluorescence measured along a line passing through the center of the puff in B1.
Fig. 4.
Fig. 4.
Quantal analysis of Ca2+ puffs. Histograms show distributions of event and step-level amplitudes derived from measurements at 87 sites in 20 cells. In all cases, the amplitudes of Ca2+ fluorescence signals are plotted after normalizing to the mean unitary event (blip) magnitude at each given site. (A) Distribution of all (n = 1,531) peak and step level amplitudes. The curve is a sum of 7 Gaussian distributions centered at integer multiples of the mean unitary event magnitude and with respective peak amplitudes/SDs of 151/0.22, 80/0.31, 46/0.32, 30/0.37, 17/0.35, 8/0.31, and 11/1.3. (B) Distribution of normalized peak amplitudes of all discrete events at all puff sites. (C) Distribution of amplitudes of the largest event observed at each site; providing a measure of the minimal number of functional IP3Rs at that site. (D) Distribution of event amplitudes as in B, after selecting only those sites where the largest puff was between 5 and 10 times the unitary event amplitude so as to reduce inter-site variability. (E) Distribution of number of IP3R channels activated by opening of an initial trigger channel, estimated by re-plotting the data in D after subtracting the initial channel. Curves show predicted distributions assuming respective models in which independent IP3Rs have equal probability of opening (open symbols), or in which the probability of opening increases linearly with the number of already open channels (filled symbols). See text for further explanation. (F) Curve shows the distribution predicted by a model comprising a cluster of 10 channels, where the probability of opening increases as a cube root function of the number of already open channels. Data are reproduced from E.
Fig. 5.
Fig. 5.
IP3R channel gating kinetics during blips and puffs. (A) Distribution of unitary blip event durations, after excluding the small proportion of events with durations >100 ms. The curve is a single exponential with time constant τ of 17 ms. (B) Histogram shows the distribution of puff durations, measured as the interval between attainment of peak amplitude and return to baseline and expressed relative to the mean blip duration of 17 ms. Data were selected from events with normalized peak amplitudes between 5 and 10, and exclude events that showed channel openings during the falling phase. The black curve shows simulated data generated assuming that 8 channels are open at the peak of the puff, and then close stochastically and independently after a mean dwell time of 17 ms. (C) Mean time to event termination as a function of the estimated number of channels open at the peak. Open symbols are experimental data. Filled symbols show the relationship predicted if channels close stochastically and independently after a mean lifetime of 17 ms. (D and E) Graphs plot, respectively, the rates of channel openings/closings as functions of time after initiation of a puff. Symbols are individual measurements of numbers of channels that opened/closed during successive 5-ms time bins, estimated from the normalized fluorescence change during that interval (Left). Curves show the mean rates of channel opening/closing averaged over varying time bins (Right).

References

    1. Berridge MJ, Lipp P, Bootman MD. The versatility and universality of calcium signalling. Nat Rev Mol Cell Biol. 2000;1:11–21. - PubMed
    1. Berridge MJ. Elementary and global aspects of calcium signalling. J Physiol. 1997;499:291–306. - PMC - PubMed
    1. Bootman M, Niggli E, Berridge M, Lipp P. Imaging the hierarchical calcium signalling system in HeLa cells. J Physiol. 1997;499:307–314. - PMC - PubMed
    1. Bootman MD, Berridge MJ, Lipp P. Cooking with calcium: the recipes for composing global signals from elementary events. Cell. 1997;91:367–373. - PubMed
    1. Thorn P, Lawrie AM, Smith PM, Gallacher DV, Petersen OH. Local and global cytosolic calcium oscillations in exocrine cells evoked by agonists and inositol trisphosphate. Cell. 1993;74:661–668. - PubMed

Publication types

Substances

LinkOut - more resources