. 2009 Apr;155(Pt 4):1080-1092.
doi: 10.1099/mic.0.024661-0.

ParB deficiency in Pseudomonas aeruginosa destabilizes the partner protein ParA and affects a variety of physiological parameters

Affiliations

ParB deficiency in Pseudomonas aeruginosa destabilizes the partner protein ParA and affects a variety of physiological parameters

A A Bartosik et al. Microbiology (Reading). 2009 Apr.

Abstract

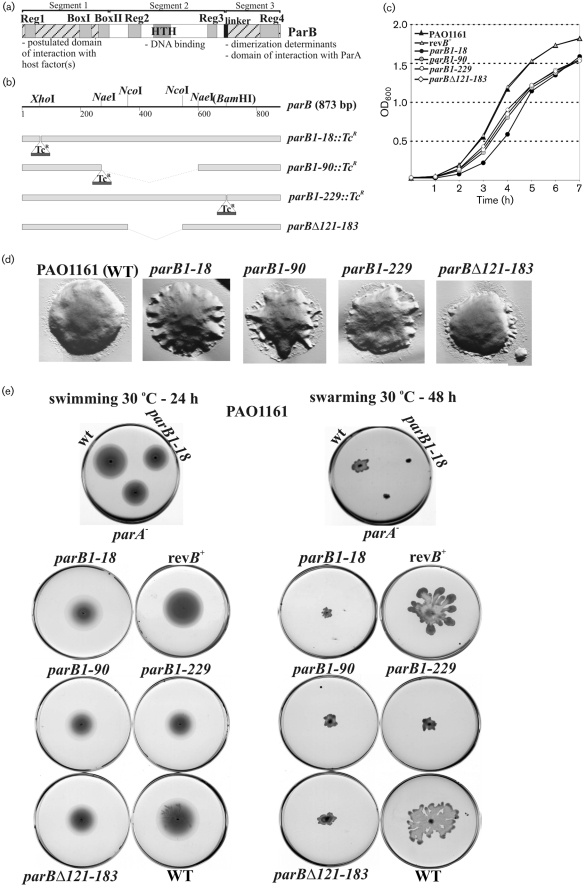
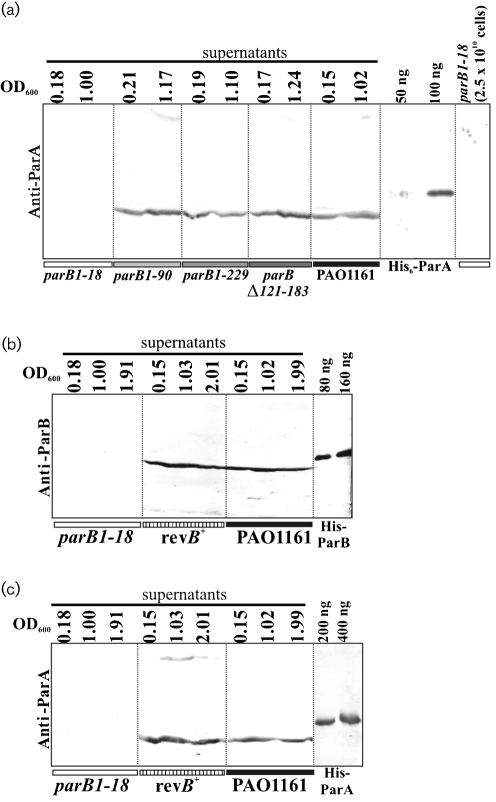
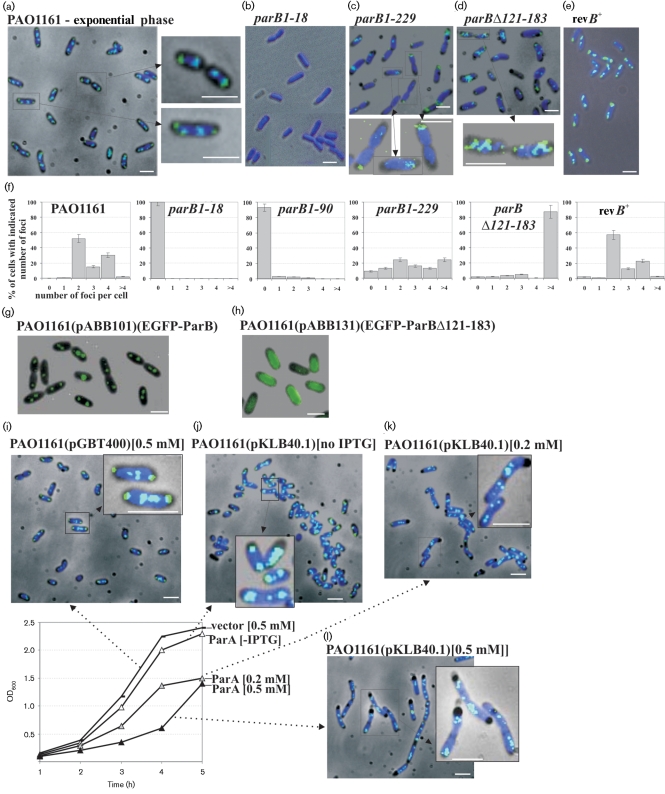
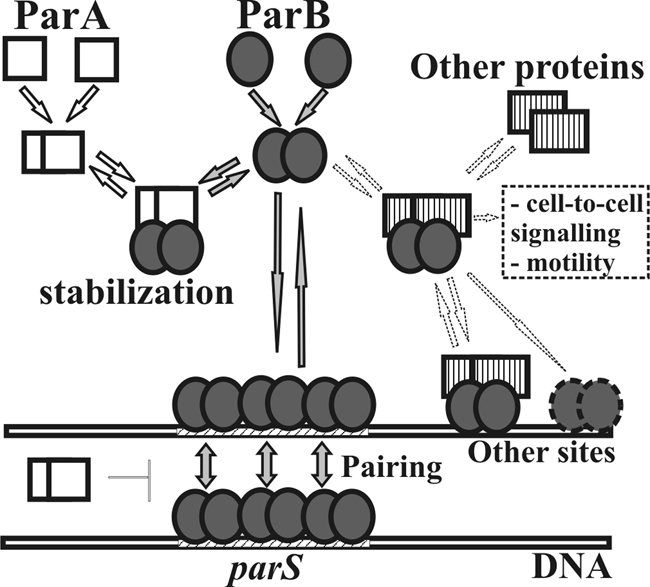
Deletions leading to complete or partial removal of ParB were introduced into the Pseudomonas aeruginosa chromosome. Fluorescence microscopy of fixed cells showed that ParB mutants lacking the C-terminal domain or HTH motif formed multiple, less intense foci scattered irregularly, in contrast to the one to four ParB foci per cell symmetrically distributed in wild-type P. aeruginosa. All parB mutations affected both bacterial growth and swarming and swimming motilities, and increased the production of anucleate cells. Similar effects were observed after inactivation of parA of P. aeruginosa. As complete loss of ParA destabilized its partner ParB it was unclear deficiency of which protein is responsible for the mutant phenotypes. Analysis of four parB mutants showed that complete loss of ParB destabilized ParA whereas three mutants that retained the N-terminal 90 aa of ParB did not. As all four parB mutants demonstrate the same defects it can be concluded that either ParB, or ParA and ParB in combination, plays an important role in nucleoid distribution, growth and motility in P. aeruginosa.


Figures

Fig. 1.
Fig. 1.
Effect of parB mutations on growth, colony formation, and swimming and swarming motility of P. aeruginosa. (a) Domain structure of ParB of P. aeruginosa. The conserved regions are marked in grey. The linker region is marked in black. The N-terminal domain of interaction with putative host factors and C-terminal domain involved in dimerization are hatched. (b) The parB gene from P. aeruginosa and its mutant derivatives constructed for allele replacement. The restriction sites shown are those used in manipulations. The tetracycline-resistance cassette (TcR; not to scale) comes from plasmid pKRP12 (Reece & Phillips, 1995). (c) Growth of WT PAO1161 strain, parB mutants and parB+ revertant strain (revB+) on rich medium at 37 °C. Overnight cultures were diluted 100-fold. The OD600 was measured at hourly intervals. (d) Colony morphology of WT and parB mutant strains observed after 24 h incubation on L agar plates at 37 °C using an Olympus IX70 microscope. Photomicrographs were projected, and visualized with DP-Soft (analySIS) software produced by Soft Imaging Systems for Olympus. The final montage was created with Adobe Photoshop, version 6.0. (e) Motility of WT, parB mutants and parB+ revertant strain tested as described in Methods. The test plates were inoculated with a sterile toothpick and incubated for 24–48 h at 30 °C. The parA strain was included to demonstrate the similarity to the ParB phenotype.
Fig. 2.
Fig. 2.
Analysis of ParA and ParB levels in WT and mutants of P. aeruginosa. (a) Samples from early- and late-exponential-phase cultures at the indicated OD600 were collected and sonicated. The cleared supernatants from about 5×10⁹ cells were analysed by 15 % SDS-PAGE, followed by transfer onto nitrocellulose membrane and reaction with semi-purified anti-ParA antibody (Lasocki et al., 2007). (b) and (c) Western blot analysis of ParB and ParA, respectively, in parB1–18 mutant, parB+ revertant (revB+) and WT PAO1161 strains. Cells were collected at three stages of culture growth (indicated by OD600). Cleared extracts from about 109 cells were analysed by 15 % SDS-PAGE followed by transfer onto nitrocellulose and immunodetection with Anti-ParB (b) and Anti-ParA (c) antibodies.
Fig. 3.
Fig. 3.
Cellular localization of ParB and its mutant forms in P. aeruginosa. (a–e) Localization of ParB in WT P. aeruginosa, mutant strains parB1–18, parB1–229 and parBΔ121–183, and parB+ revertant strain (revB+). Images show the location of ParB in the cells from the exponential phase of cultures grown in rich medium at 37 °C. Higher magnification of representative cells is also shown. Immunofluorescence and phase-contrast micrographs are overlaid. The dark background is a phase-contrast image, the dark blue is the DAPI-stained chromosome and the green/light blue is the FITC-stained ParB. (f) Bar charts showing the percentage of cells with different numbers of ParB foci for various strains. At least 500 cells were counted for each strain. (g, h) Overlaid phase-contrast and EGFP fluorescence images showing the cellular localization of the EGFP-ParB and EGFP-ParBΔ121–183 fusion proteins in living cells of P. aeruginosa. Cells from the PAO1161(pABB101) and PAO1161(pABB131) cultures, grown in L broth at 24 °C, were collected after 2–3 h induction with 0.2 mM IPTG and immediately prepared for microscopic examination. The dark background is the phase-contrast image and the green colour represents EGFP fused to ParB and ParBΔ121–183, respectively. (i–l) Immunofluorescence–phase-contrast overlay micrographs showing the localization of WT ParB in P. aeruginosa PAO1161(pKLB40.1tacp-parA) overproducing ParA protein. The graph presents the growth curves of PAO1161(pGBT400) and PAO1161(pKLB40.1) cultures grown in rich medium at 37 °C, from which the samples were collected for immunofluorescence microscopy. Different concentrations of IPTG were applied to overproduce ParA. PAO1161(pGBT400) cells grown in the presence of 0.5 mM IPTG were used as a control. The dark background is the phase-contrast image, the dark blue is the DAPI-stained chromosome and the green/light blue is the FITC-stained ParB. Scale bars 2 μm (all panels).
Fig. 4.
Fig. 4.
Model of action of Par proteins in P. aeruginosa. ParA and ParB proteins are able to interact with each other. ParB binds to parS sequences within the chromosome and spreads along DNA starting from parS. ParA may control the pairing of ParB–DNA complexes. ParB may also recognize other binding sites through interactions with other partners. Different complexes are involved in different cell processes such as chromosome segregation, cell division and motility.

Similar articles

Cited by

References

    1. Adachi, S., Hori, K. & Hiraga, S. (2005). Subcellular positioning of F plasmid mediated by dynamic localization of SopA and SopB. J Mol Biol 356, 850–863. - PubMed
    1. Autret, S., Nair, R. & Errington, J. (2001). Genetic analysis of the chromosome segregation protein Spo0J of Bacillus subtilis: evidence for separate domains involved in DNA binding and interactions with Soj protein. Mol Microbiol 41, 743–755. - PubMed
    1. Bartosik, A. A., Lasocki, K., Mierzejewska, J., Thomas, C. M. & Jagura-Burdzy, G. (2004). ParB of Pseudomonas aeruginosa: interactions with its partner ParA and its target parS and specific effects on bacterial growth. J Bacteriol 186, 6983–6998. - PMC - PubMed
    1. Biek, D. P. & Strings, J. (1995). Partition functions of mini-F affect plasmid DNA topology in Escherichia coli. J Mol Biol 246, 388–400. - PubMed
    1. Bignell, C. & Thomas, C. M. (2001). The bacterial ParA-ParB partitioning proteins. J Biotechnol 91, 1–34. - PubMed

Publication types

MeSH terms

Substances