. 2009 Apr 13;206(4):819-31.
doi: 10.1084/jem.20080003. Epub 2009 Mar 30.

Loss of STAT5 causes liver fibrosis and cancer development through increased TGF-{beta} and STAT3 activation

Affiliations

Loss of STAT5 causes liver fibrosis and cancer development through increased TGF-{beta} and STAT3 activation

Atsushi Hosui et al. J Exp Med. .

Abstract

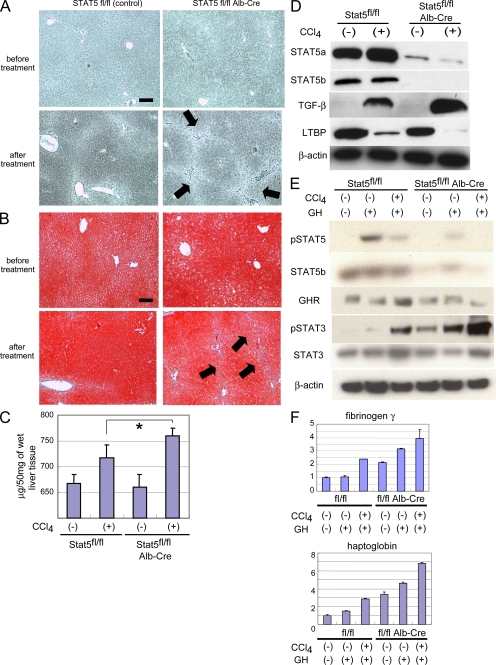
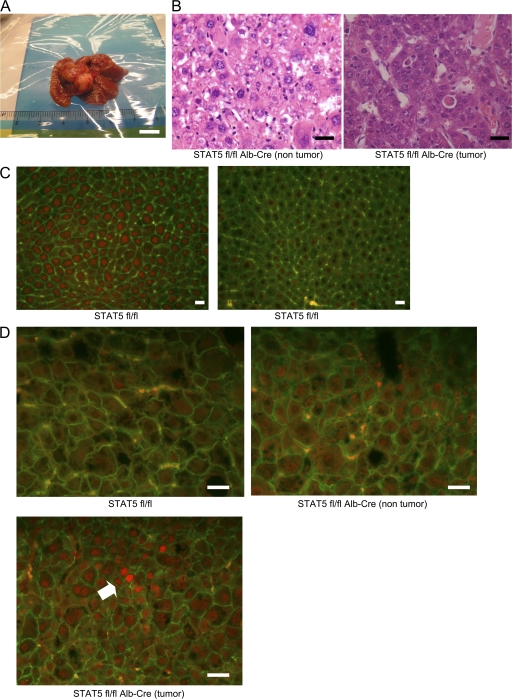
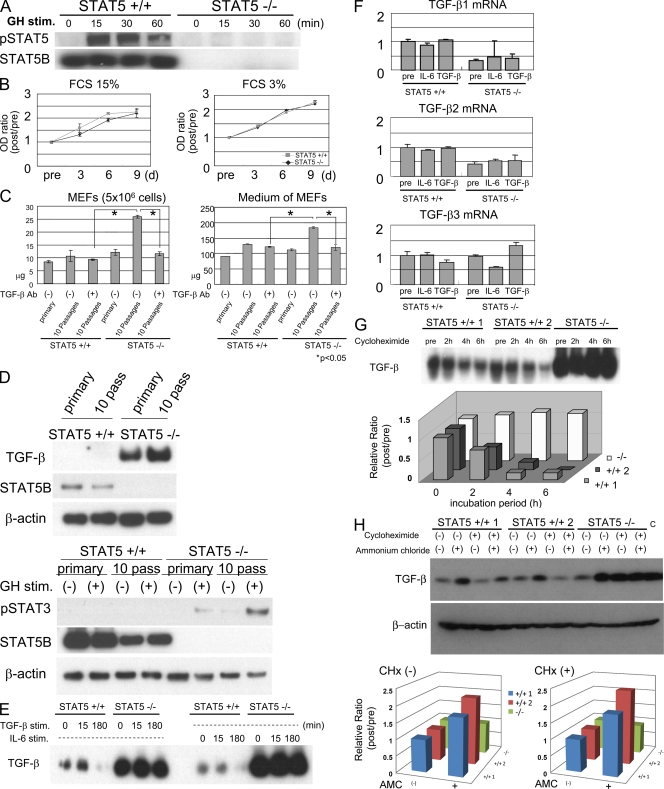
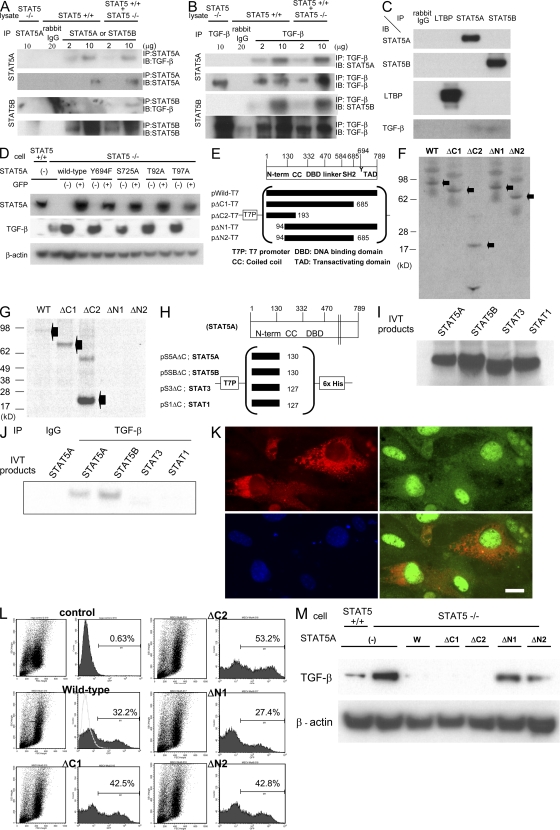
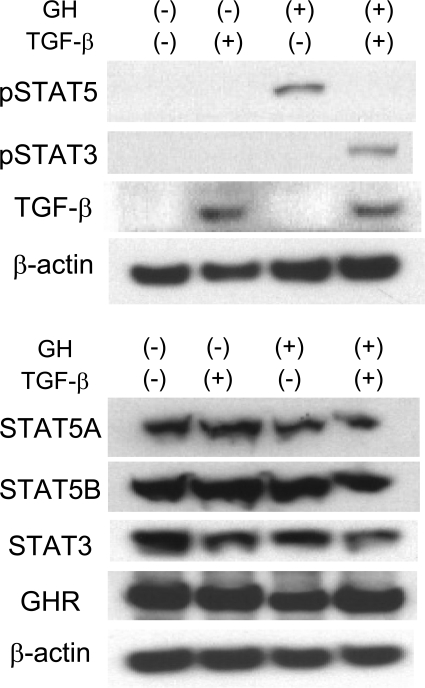
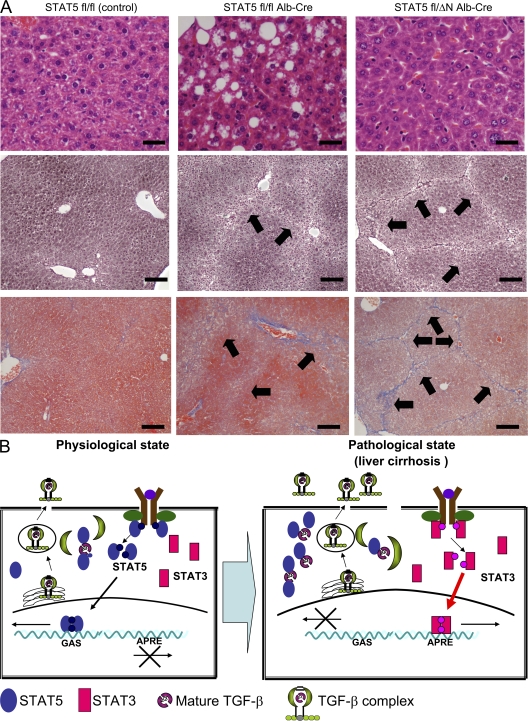
The molecular mechanisms underlying the development of hepatocellular carcinoma are not fully understood. Liver-specific signal transducer and activator of transcription (STAT) 5A/B-null mice (STAT5-LKO) were treated with carbon tetrachloride (CCl(4)), and histological analyses revealed liver fibrosis and tumors. Transforming growth factor (TGF)-beta levels and STAT3 activity were elevated in liver tissue from STAT5-LKO mice upon CCl(4) treatment. To define the molecular link between STAT5 silencing and TGF-beta up-regulation, as well as STAT3 activation, we examined STAT5-null mouse embryonic fibroblasts and primary hepatocytes. These cells displayed elevated TGF-beta protein levels, whereas messenger RNA levels remained almost unchanged. Protease inhibitor studies revealed that STAT5 deficiency enhanced the stability of mature TGF-beta. Immunoprecipitation and immunohistochemistry analyses demonstrated that STAT5, through its N-terminal sequences, could bind to TGF-beta and that retroviral-mediated overexpression of STAT5 decreased TGF-beta levels. To confirm the in vivo significance of the N-terminal domain of STAT5, we treated mice that expressed STAT5 lacking the N terminus (STAT5-DeltaN) with CCl(4). STAT5-DeltaN mice developed CCl(4)-induced liver fibrosis but no tumors. In conclusion, loss of STAT5 results in elevated TGF-beta levels and enhanced growth hormone-induced STAT3 activity. We propose that a deregulated STAT5-TGF-beta-STAT3 network contributes to the development of chronic liver disease.


Figures

Figure 1.
Figure 1.
Progression of liver fibrosis in hepatocyte-specific Stat5A/B KO mice. (A and B) Silver staining (A) and Azan staining (B) of liver sections from STAT5A/Bf/f (control) mice and STAT5A/Bf/f;Alb-Cre (STAT5-LKO) mice before and after CCl4 treatment for 8 wk. Arrows indicate reticular fibers. All pictures are shown in low magnification (100×). Bars, 200 µm. (C) Quantification of total acid pepsin-soluble collagens in liver tissue of STAT5A/Bf/f and STAT5A/Bf/f;Alb-Cre before and after CCl4 treatment. Data are mean ± SD. The asterisk indicates a significant difference (P = 0.023) between the control and KO mice (n = 5–7). (D) Expression levels of STAT5A, STAT5B, TGF-β, and LTBP in liver from control and KO mice before and after the treatment as detected by Western blot analysis. (E) Activation levels of STAT5 and STAT3 and expression levels of STAT5, STAT3, and GH receptor (GHR) in liver from control and KO mice before and after CCl4 treatment with or without GH stimulation as detected by Western blot analysis. (F) Expression levels of fibrinogen γ and Haptoglobin in liver from control and STAT5-LKO mice before and after CCl4 treatment with or without GH stimulation as detected by real-time RT-PCR analysis. The relative expression level of the untreated sample of control mice was set as 1, and the fold expression level of each sample was calculated (n = 3 in each group). Data are mean ± SD. Three independent experiments were performed in triplicate and representative data were shown.
Figure 2.
Figure 2.
Development of cancer in hepatocyte-specific STAT5A/B KO mice. (A) Appearance of a representative hepatic tumor from STAT5A/Bf/f;Alb-Cre mice after CCl4 treatment. Bar, 1 cm. (B) H&E staining of nontumor (left) and tumor (right) sections from STAT5A/Bf/f;Alb-Cre after CCl4 treatment. Bars, 40 µm. (C) Livers from STAT5f/f (left) and STAT5f/f;Alb-Cre (right) mice were harvested 30 min after GH injection and analyzed for STAT5B expression using by immunofluorescent staining with anti-STAT5B (red) and anti–β-catenin (green) antibodies. Bars, 40 µm. (D) Tissues from STAT5f/f (top) and STAT5A/Bf/f;Alb-Cre (nontumor, top right; tumor, bottom) after CCl4 treatment are analyzed for pSTAT3 activation using immunofluorescent staining with anti-pSTAT3 (red) and anti–β-catenin (green) antibodies. Strong activation of pSTAT3 is detected around the arrow. Bars, 40 µm.
Figure 3.
Figure 3.
TGF-β protein levels are enhanced in STAT5A/B-null MEFs. (A) Changes in the pSTAT5 and STAT5B levels in control and STAT5-null MEFs before and after GH stimulation as detected by Western blot analysis. (B) Control and STAT5-null MEFs were seeded on a 96-well culture plate, maintained in 15% FCS (left) or 3% FCS (right), and viable cells were assessed by the WST colorimetric assay. Data are mean ± SD. (C) Quantification of total collagen in cell lysates of MEFs (left) or in culture medium (right). Primary MEFs (bars 1 and 4) or MEFs after 10 passages in the absence (bars 2 and 5) or presence (bars 3 and 6) of TGF-β antibody were used. Neutralization antibody was added to the medium every passage (final concentration, 100 ng/ml). Data are mean ± SD. The asterisks indicate significant differences (left, P = 0.024 [left] or P = 0.011 [right]; right, P = 0.021 [left] or P = 0.024 [right]). (D) Changes in TGF-β levels and STAT3 activation in primary MEFs and MEFs after 10 passages before and after GH stimulation as detected by Western blot analysis. (E) Changes in TGF-β levels of cell lysates in control and STAT5-null MEFs before and after TGF-β or IL-6 stimulation as detected by Western blot analysis. (F) Expression levels of TGF-β1, β2, and β3 mRNA in both cells before and after stimulation as detected by real-time RT-PCR analysis. The relative expression level of untreated sample of control MEFs was considered as 1, and the fold expression level of each sample was calculated. Data are mean ± SD. (G and H) Changes in TGF-β levels in control (two lines were used) and STAT5-null MEFs before and after CHx or ammonium chloride treatment. The intensity of protein bands was measured by AlphaImager (Alpha Innotech). The relative intensity level of the untreated sample of each MEF was considered as 1, and the intensity level of each sample was calculated. Three independent experiments were performed and representative data are shown. Recombinant murine TGF-β protein (Wako Chemicals USA, Inc.) was used as a positive control (H, right).
Figure 4.
Figure 4.
STAT5 binds to TGF-β and controls its levels. (A and B) Cellular lysates from wild-type and/or STAT5-null MEFs were immunoprecipitated with nonspecific γ-globulin and antibodies against STAT5A/B or TGF-β, and the immunoprecipitates were subjected to Western blotting. (C) Cellular lysates from STAT5 wild-type MEFs were immunoprecipitated with nonspecific γ-globulin and antibodies against LTBP or STAT5A/B. The immunoprecipitates were subjected to Western blotting. (D) Expression levels of STAT5A and TGF-β in wild-type MEFs, STAT5-null MEFs, and STAT5-null MEFs infected with various kinds of retroviral STAT5-expressing vector. After infection, GFP-negative/positive cells were sorted and applied to Western blot analysis. (E and H) Schematic presentation of protein-expressing plasmids. (F and I) Aliquots of in vitro translation products from each plasmid were fractionated by SDS-PAGE. The proteins were labeled with l-[35S]methionine. (G and J) In vitro–synthesized wild-type and mutant STAT5A and the N-terminal domain of each STAT protein were mixed with cellular lysates and immunoprecipitated with TGF-β antibody. (K) STAT5-null MEFs were infected with STAT5A-GFP–expressing retrovirus and transfected with pUB6–TGF-β–V5, which expresses a TGF-β–V5 fusion protein. Cells were analyzed for TGF-β and STAT5A using immunofluorescent staining with anti-V5 (red) and anti-GFP (green) antibodies. Nuclei were stained with DAPI (blue). Bar, 10 µm. (L) Flow cytometry detection of STAT5-GFP–infected cells from STAT5 KO MEFs infected with various kinds of STAT5-expressing retrovirus. The ratio of GFP-positive cells is shown in each graph. (M) TGF-β levels in wild-type, STAT5-null MEFs, and STAT5-null MEFs infected with different STAT5-expressing retroviruses. After infection, GFP-positive cells were sorted and subjected to Western blotting.
Figure 5.
Figure 5.
GH-induced STAT3 and STAT5 activation is modulated by TGF-β. Phosphorylation levels of STAT5 and STAT3 and expression levels of TGF-β, STAT5A, STAT5B, STAT3, and GH receptor in STAT5 wild-type MEFs before and after GH stimulation were determined by Western blot analysis. STAT5 wild-type MEFs were infected with a retrovirus based on pMSCV–TGF-β–GFP vector, sorted, and applied to Western blot analysis.
Figure 6.
Figure 6.
The N-terminal domain of STAT5 is critical for the development of liver fibrosis. (A) H&E staining of liver sections from control, STAT5-LKO, and STAT5-ΔN mice before CCl4 treatment (top) and silver (middle) and azan (bottom) staining of liver sections from these mice after CCl4 treatment. Arrows indicate reticular fibers. H&E images are shown at high magnification (400×; bars, 50 µm), and others are at low magnification (100×; bars, 200 µm). n = 3–5 in each group. (B) Model for the development of liver fibrosis and cancer through elevated expression of TGF-β and activation of STAT3 in hepatocytes. Under physiological conditions, TGF-β is present at low or nondetectable levels and some is secreted after binding to LTBP in a constitutive fashion. STAT5 binds to TGF-β and interferes with the formation of TGF-β complex, resulting in suppression of TGF-β protein stability. At this level of TGF-β, STAT5 levels and activation are not influenced. Upon development of liver fibrosis, TGF-β levels increase and LTBP levels decrease. Under these conditions, STAT5 is sequestered by TGF-β and can no longer be activated by GH. Instead, GH activates STAT3.

References

    1. Yoshikawa H., Matsubara K., Qian G.S., Jackson P., Groopman J.D., Manning J.E., Harris C.C., Herman J.G. 2001. SOCS-1, a negative regulator of the JAK/STAT pathway, is silenced by methylation in human hepatocellular carcinoma and shows growth-suppression activity.Nat. Genet. 28:29–35 - PubMed
    1. Satoh S., Daigo Y., Furukawa Y., Kato T., Miwa N., Nishiwaki T., Kawasoe T., Ishiguro H., Fujita M., Tokino T., et al. 2000. AXIN1 mutations in hepatocellular carcinomas, and growth suppression in cancer cells by virus-mediated transfer of AXIN1.Nat. Genet. 24:245–250 - PubMed
    1. Raghow R., Postlethwaite A.E., Keski-Oja J., Moses H.L., Kang A.H. 1987. Transforming growth factor-beta increases steady state levels of type I procollagen and fibronectin messenger RNAs posttranscriptionally in cultured human dermal fibroblasts.J. Clin. Invest. 79:1285–1288 - PMC - PubMed
    1. Czaja M.J., Weiner F.R., Flanders K.C., Giambrone M.A., Wind R., Biempica L., Zern M.A. 1989. In vitro and in vivo association of transforming growth factor–β1 with hepatic fibrosis.J. Cell Biol. 108:2477–2482 - PMC - PubMed
    1. Derynck R., Jarrett J.A., Chen E.Y., Eaton D.H., Bell J.R., Assoian R.K., Roberts A.B., Sporn M.B., Goeddel D.V. 1985. Human transforming growth factor-beta complementary DNA sequence and expression in normal and transformed cells.Nature. 316:701–705 - PubMed

Publication types