. 2009;4(3):e4951.
doi: 10.1371/journal.pone.0004951. Epub 2009 Mar 31.

Characterisation of the fibroblast growth factor dependent transcriptome in early development

Affiliations

Characterisation of the fibroblast growth factor dependent transcriptome in early development

Peter A Branney et al. PLoS One. 2009.

Abstract

Background: FGF signaling has multiple roles in regulating processes in animal development, including the specification and patterning of the mesoderm. In addition, FGF signaling supports self renewal of human embryonic stem cells and is required for differentiation of murine embryonic stem cells into a number of lineages.

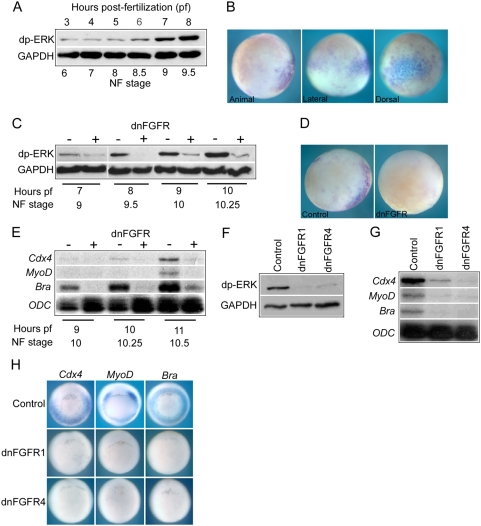
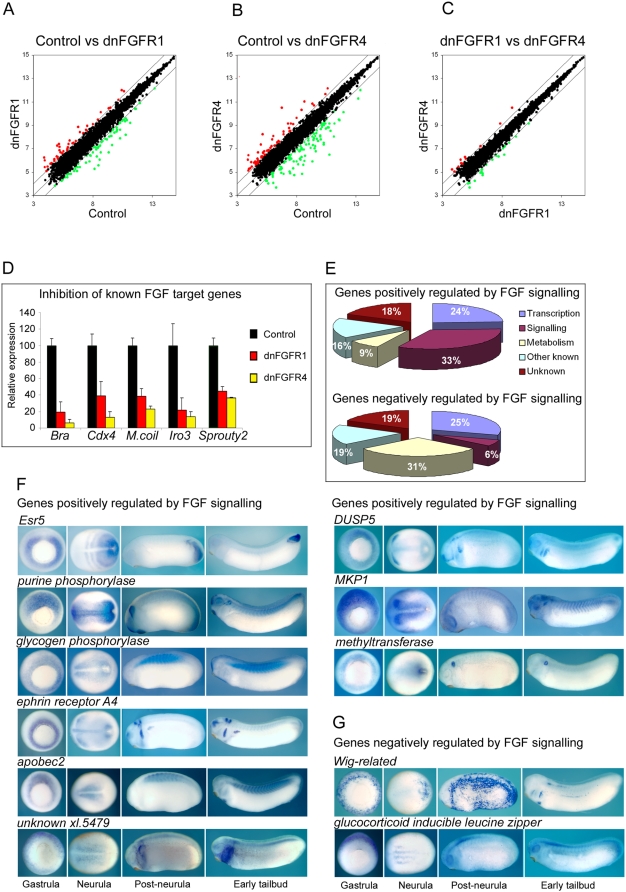
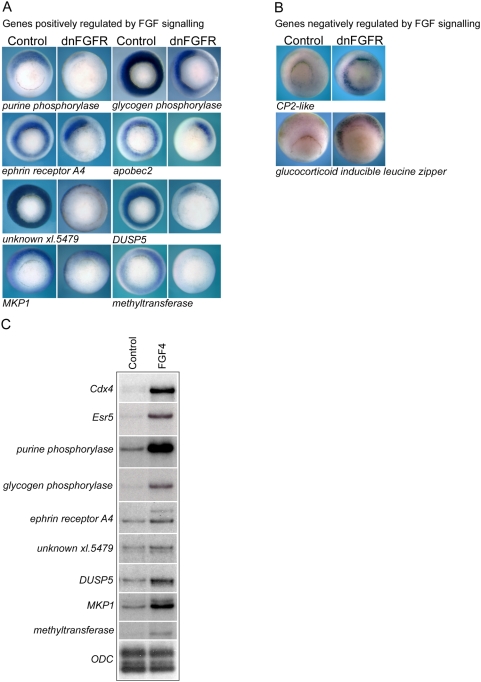
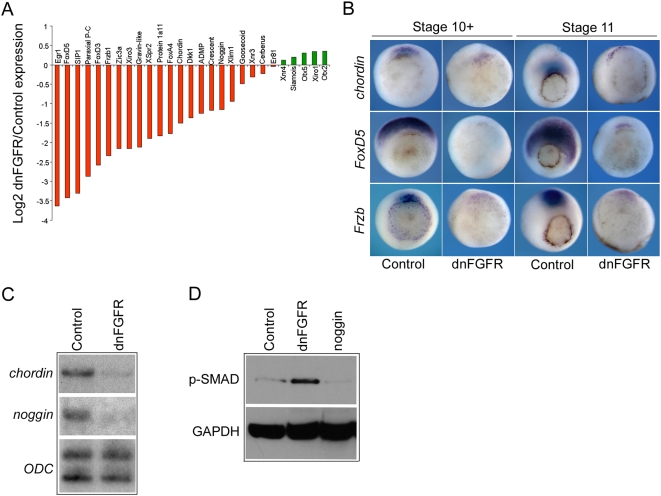
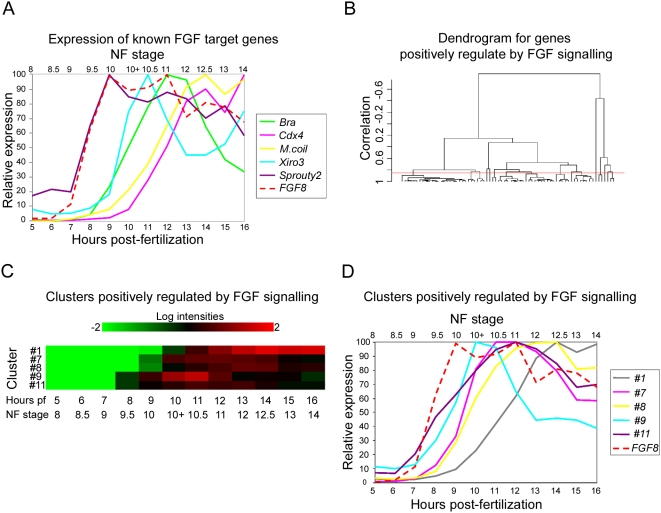
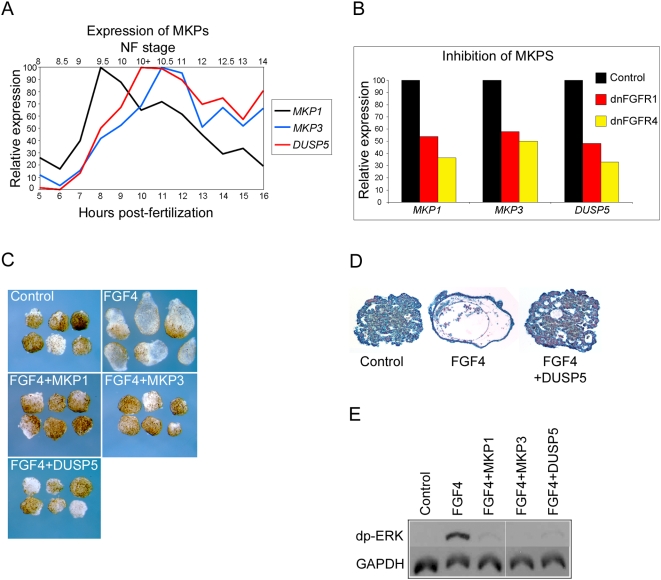
Methodology/principal findings: Given the importance of FGF signaling in regulating development and stem cell behaviour, we aimed to identify the transcriptional targets of FGF signalling during early development in the vertebrate model Xenopus laevis. We analysed the effects on gene expression in embryos in which FGF signaling was inhibited by dominant negative FGF receptors. 67 genes positively regulated by FGF signaling and 16 genes negatively regulated by FGF signaling were identified. FGF target genes are expressed in distinct waves during the late blastula to early gastrula phase. Many of these genes are expressed in the early mesoderm and dorsal ectoderm. A widespread requirement for FGF in regulating genes expressed in the Spemann organizer is revealed. The FGF targets MKP1 and DUSP5 are shown to be negative regulators of FGF signaling in early Xenopus tissues. FoxD3 and Lin28, which are involved in regulating pluripotency in ES cells are shown to be down regulated when FGF signaling is blocked.

Conclusions: We have undertaken a detailed analysis of FGF target genes which has generated a robust, well validated data set. We have found a widespread role for FGF signaling in regulating the expression of genes mediating the function of the Spemann organizer. In addition, we have found that the FGF targets MKP1 and DUSP5 are likely to contribute to the complex feedback loops involved in modulating responses to FGF signaling. We also find a link between FGF signaling and the expression of known regulators of pluripotency.


Conflict of interest statement

Competing Interests: The authors have declared that no competing interests exist.

Figures

Figure 1
Figure 1. FGF signaling in early development.
(A) is a Western blot showing levels of diphospo-ERK (dp-ERK) in whole embryos from cleavage stage 6 to late blastula stage 9.5 (3 to 8 hours pf at 23°C). GAPDH is a ubiquously expressed loading control. (B) shows whole mount immunohistochemistry for dp-ERK in blastula stage 9 embryos. In animal hemisphere view dorsal side is to the right. In lateral view the animal hemisphere is to the top and the dorsal side is to the right. In dorsal view the animal hemisphere is to the top. (C) is a Western blot comparing dp-ERK levels in control uninjected embryos and embryos injected with 4 ng dnFGFR4 mRNA from blastula stage 9 to early gastrula stage 10.25. (D) shows whole mount immunohistochemistry for dp-ERK at blastula stage 9 in a control uninjected embryo and an embryo injected with 4 ng dnFGFR4 embryo. Embryos are viewed from the animal hemisphere with dorsal side to the right. (E) is an RNAase protection analysis (RPA) showing the expression of Cdx4, MyoD, brachyury and ODC in control uninjected embryos and embryos injected with 4 ng dnFGFR4 mRNA from early gastrula stage 10 until stage 10.5. ODC is a ubiquioulsy expressed loading control. 10 µg of total RNA were used per hybridization. (F) is a Western blot showing dp-ERK levels in control uninjected embryos, embryos injected with 4 ng dnFGFR1 mRNA and embryos injected with 4 ng dnFGFR4 mRNA at early gastrula stage 10.5. The embryos are siblings to one set of the three biological replicates used for the microarray analysis. (G) is an RPA showing expression of Cdx4, MyoD and brachyury in control uninjected embryos, embryos injected with 4 ng dnFGFR1 mRNA and embryos injected with 4 ng dnFGFR4 mRNA at early gastrula stage 10.5. The embryos are siblings to one set of the three biological replicates used for the microarray analysis. (H) shows whole mount in situ hybridizations for Cdx4, MyoD and brachyury in control uninjected embryos , embryos injected with 4 ng dnFGFR1 mRNA and embryos injected with 4 ng dnFGFR4 mRNA at early gastrula stage 10.5. The embryos are siblings to one set of the three biological replicates used for the microarray analysis.
Figure 2
Figure 2. Identification of FGF target genes.
(A, B and C) are scatterplots of log2 probeset expression values from the Affymetrix microanalysis undertaken on early gastrula stage 10.5 control embryos, dnFGFR1 injected embryos and dnFGFR4 injected embryos . Values for each point are the average of three biological replicates. The centre line represents a ratio of 1∶1 between the two groups indicating no difference in expression. The outlying lines represent two fold differences in expression. Points representing probe sets showing ≥2 reduction in expression are indicated in green. Points representing probesets showing ≥2 increase in expression are indicated in red. (D) is a chart showing the expression of brachyury (bra), cdx4, marginal coil (M.coil), Iro3 and sprouty2 in control embryos and embryos injected with 4 ng dnFGFR1 mRNA or 4 ng dnFGFR4 mRNA. Microarray derived expression values are based on the average of three biological replicates. Relative expression is calculated as a percentage of the expression in control embryos. Standard deviation bars are indicated. (E) shows pie charts of genes positively and negatively regulated by FGF signaling. Percentages of each group classified according to their putative cellular function are indicated. Details of the up regulated and down regulated genes are contained Tables 1, 2 and Tables S2 to S11. (F) shows the expression patterns of genes positively regulated by FGF signaling at determined by in situ hybridization at early gastrula stage 10.5, early neurula stage 14, post-neurula stage 22 and early tailbud stage 30. Gastrula embryos are vegetal views with dorsal to the top. Neurula embryos are dorsal views with anterior to the left. Post-neurula and tailbud embryos are lateral view with dorsal to the top and anterior to the left. (G) shows the expression patterns of genes negatively regulated by FGF signaling.
Figure 3
Figure 3. Validation of FGF target genes.
(A) shows whole mount in situ hybridizations for genes positively regulated by FGF signaling at gastrula stage 10.5 in control embryos and embryos injected with 2 ng of dnFGFR1 mRNA. (B) shows the expression gene negatively regulated by FGF signaling in control embryos and embryos injected with 2 ng dnFGFR1 mRNA. All embryos are vegetal view with dorsal to the top. Non-uniform down regulation around the circumference of the blastopore is apparent in some embryos and is likely due to variability in the diffusion of injected dnFGFR mRNA. (C) is an RPA showing the expression at gastrula stage 10.5 of a number of genes in control animal cap explants and explants treated with FGF4 protein. 5 µg total RNA was used per hybridization. ODC is a loading control.
Figure 4
Figure 4. FGF signaling and regulation of dorsal gene expression.
(A) is a bar chart showing the log2 of the ratio of expression dnFGFR4 injected embryos versus control embryos for a number of dorsally expressed genes at gastrula stage 10.5. Microarray derived expression values are based on the average of three biological replicates. Bars in red below the centre line represents genes down regulated in response to FGF inhibition. Bars in green represent genes up regulated in response to FGF inhibition. (B) shows whole mount in situ hybridizations for chordin, FoxD5 and Frzb in control embryos and embryos injected with 4 ng dnFGF4 mRNA at very early gastrula stage 10+ and mid-gastrula stage 11. All embryos are vegetal views with dorsal to the top. (C) is an RPA showing the expression of chordin and noggin in control embryos and embryos injected with 4 ng dnFGFR1 mRNA at gastrula stage 10.5. (D) is a Western blot showing levels of phospho-SMAD1/5/8 (p-SMAD) at gastrula stage 10.5 in control embryos, embryos injected with 4 ng dnFGFR1 mRNA or 1 ng mRNA coding for secreted the BMP inhibitor noggin. GAPDH is a loading control.
Figure 5
Figure 5. Cluster analysis of genes down regulated in response to FGF inhibition.
(A) shows the temporal expression profiles of FGF8 (dashed line) and several known FGF target genes from blastula stage 8 until early neurula stage 14 (5 to 16 hours pf at 23°C). Profiles are derived from normalised microarray expression levels. Relative expression values are represented as percentages of the maximum expression value for each gene. (B) is a cluster dendrogram generated within BRB-ArrayTools for genes that are significantly down regulated in response to FGF inhibition i.e. positively regulated by FGF signaling. The red line indicates the level at which the dendrogram was cut, corresponding to a correlation coefficient of 0.85. (C) is a heat map of temporal expression for gene clusters positively regulated by FGF signalling. Only clusters containing ≥5 members are presented. Values at each time point from blastula stage 8 to early neurula stage 14 are derived from the mean of the expression levels for all the genes in each cluster. (D) shows the temporal expression profiles of FGF8 and gene clusters positively regulated by FGF signalling based upon the mean of the expression levels for all the genes in each cluster.
Figure 6
Figure 6. MKPs and FGF signalling.
(A) shows the temporal expression profiles of MKP1, MKP3 and DUSP5 from blastula stage 8 until early neurula stage 14 (5 to 16 hours pf at 23°C). Profiles are derived from normalised microarray expression levels. Relative expression values are represented as percentages of the maximum expression value for each gene. (B) is a chart showing the expression of MKP1. MKP3 and DUSP5 in control embryos and embryos injected with 4 ng dnFGFR1 mRNA or 4 ng dnFGFR4 mRNA. Microarray derived expression values are based on the average of three biological replicates. Relative expression is calculated a percentage of the expression in control embryos. Experiments in (C, D and E) were carried out on animal cap explants removed from blastula stage 8 embryos. In all cases control explants are from uninjected embryos, FGF4 treatment was with 10 units of recombinant protein and mRNA injections were with 10 ng MKP1, MKP3 or DUSP5. (C) shows the morphology of animal cap explants at tailbud stage 41. (D) shows 10 µm histological sections of animal cap explants at stage 41. (E) is a Western blot showing levels of dp-ERK and the loading control GAPDH in animal cap explants at stage 10.5.

References

    1. Bottcher RT, Niehrs C. Fibroblast growth factor signaling during early vertebrate development. Endocr Rev. 2005;26:63–77. - PubMed
    1. Griffin K, Patient R, Holder N. Analysis of FGF function in normal and no tail zebrafish embryos reveals separate mechanisms for formation of the trunk and the tail. Development. 1995;121:2983–2994. - PubMed
    1. Ciruna B, Rossant J. FGF signaling regulates mesoderm cell fate specification and morphogenetic movement at the primitive streak. Dev Cell. 2001;1:37–49. - PubMed
    1. Mathieu J, Griffin K, Herbomel P, Dickmeis T, Strahle U, et al. Nodal and Fgf pathways interact through a positive regulatory loop and synergize to maintain mesodermal cell populations. Development. 2004;131:629–641. - PubMed
    1. Amaya E, Stein PA, Musci TJ, Kirschner MW. FGF signalling in the early specification of mesoderm in Xenopus. development. 1993;118:477–487. - PubMed

Publication types

MeSH terms

Substances