. 2009;4(3):e5091.
doi: 10.1371/journal.pone.0005091. Epub 2009 Mar 31.

The brightness of colour

Affiliations

The brightness of colour

David Corney et al. PLoS One. 2009.

Abstract

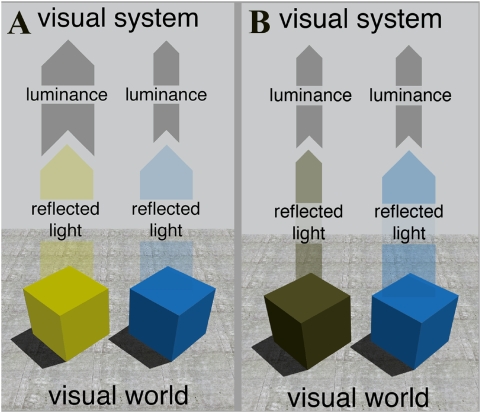
Background: The perception of brightness depends on spatial context: the same stimulus can appear light or dark depending on what surrounds it. A less well-known but equally important contextual phenomenon is that the colour of a stimulus can also alter its brightness. Specifically, stimuli that are more saturated (i.e. purer in colour) appear brighter than stimuli that are less saturated at the same luminance. Similarly, stimuli that are red or blue appear brighter than equiluminant yellow and green stimuli. This non-linear relationship between stimulus intensity and brightness, called the Helmholtz-Kohlrausch (HK) effect, was first described in the nineteenth century but has never been explained. Here, we take advantage of the relative simplicity of this 'illusion' to explain it and contextual effects more generally, by using a simple Bayesian ideal observer model of the human visual ecology. We also use fMRI brain scans to identify the neural correlates of brightness without changing the spatial context of the stimulus, which has complicated the interpretation of related fMRI studies.

Results: Rather than modelling human vision directly, we use a Bayesian ideal observer to model human visual ecology. We show that the HK effect is a result of encoding the non-linear statistical relationship between retinal images and natural scenes that would have been experienced by the human visual system in the past. We further show that the complexity of this relationship is due to the response functions of the cone photoreceptors, which themselves are thought to represent an efficient solution to encoding the statistics of images. Finally, we show that the locus of the response to the relationship between images and scenes lies in the primary visual cortex (V1), if not earlier in the visual system, since the brightness of colours (as opposed to their luminance) accords with activity in V1 as measured with fMRI.

Conclusions: The data suggest that perceptions of brightness represent a robust visual response to the likely sources of stimuli, as determined, in this instance, by the known statistical relationship between scenes and their retinal responses. While the responses of the early visual system (receptors in this case) may represent specifically the statistics of images, post receptor responses are more likely represent the statistical relationship between images and scenes. A corollary of this suggestion is that the visual cortex is adapted to relate the retinal image to behaviour given the statistics of its past interactions with the sources of retinal images: the visual cortex is adapted to the signals it receives from the eyes, and not directly to the world beyond.


Conflict of interest statement

Competing Interests: The authors have declared that no competing interests exist.

Figures

Figure 1
Figure 1. Demonstration stimulus for the Helmholtz-Kohlrausch effect.
Top: Example of a stimulus used to measure the relationship between reflectance, luminance and brightness. Bottom: The wedge most frequently selected by subjects as the best match to the brightness of the blue dot. The wedges that are equally radiant and equally luminant with the blue dot are also indicated.
Figure 2
Figure 2. The Bayesian ideal observer predictions of reflectance.
A) Predictions of reflectance as σ (the physical correlate of saturation) varies, for a constant luminance. Low saturation surfaces lead to low predictions of reflectance, and high saturation to high predictions of reflectance. Error bars indicate 1 standard error. B) Predictions of reflectance as μ (the physical correlate of hue) varies, for a constant luminance. The ideal observer predictions of reflectance for different dominant wavelengths, grouped by low (L, 0.013), medium (M, 0.051) and high (H, 0.14) luminance values. This shows that for any given luminance, yellows and greens are seen as less reflective than blues and reds. Error bars indicate 1 standard error.
Figure 3
Figure 3. Ideal observer predictions when training scenes with altered scene or image statistics.
A) Ideal observer predictions when training scenes are biased towards “green”. The training set of SRFs is a mixture of 3 Gaussians as before, but here one component is forced to be centred at 550 nm, which typically appears green. For comparison, the previous “default” results from Figure 2B are shown using dotted lines. B) Ideal observer predictions when training scenes are biased towards “red” and “blue”. The training set SRFs are still a mixture of 3 Gaussians as before, but here one component is forced to be centred at either 450 nm (“blue”) or 650 nm (“red”) for each surface. For comparison, the previous “default” results are shown using dotted lines. C) Ideal observer predictions with increased M λ-max. The M-cone peak sensitivity is now 560 nm on both training and test sets, instead of the usual 545 nm. For comparison, the previous “default” results are shown using dotted lines. D) Ideal observer predictions with decreased M λ-max. The M-cone peak sensitivity is now 505 nm on both training and test sets, instead of the usual 545 nm. This is mid-way between L-cone and S-cone λ-max values. For comparison, the previous “default” results are shown using dotted lines.
Figure 4
Figure 4. Ideal observer predictions with a green-absorbing filter.
A) Ideal observer predictions when trained with a green-absorbing filter and tested with the same filter on the standard test set. For comparison, the previous “default” results are shown using dotted lines. The predictions are now smaller, but follow the same overall pattern. B) Ideal observer predictions when trained with a green-absorbing filter and tested on the “unfiltered” standard test set. For comparison, the previous “default” results are shown using dotted lines. The predictions now follow a very different pattern.
Figure 5
Figure 5. fMRI experiments: stimuli and results.
Top row: The blue standard (left), equiluminant yellow (middle), and equally bright (right) annuli used in the first fMRI experiment; the relative responses (percent signal change) of primary visual cortex (V1) to the these stimuli (in the same left-to-right order as shown in the left panels) are shown on the right for two subjects (S1, S2). Error bars indicate one standard error. Bottom row: Blue standard (left), equiluminant low-saturated blue (middle), and equally bright low-saturated blue (right) annuli used in the second fMRI experiment; again the relative response of primary visual cortex (V1) of two subjects to these stimuli are indicated on the right (S2, S3). Display conventions are as for the upper row. Evidently V1 activity is consistent with the probable image-source relationship rather than the characteristics of the stimuli as such.
Figure 6
Figure 6. Relationship between luminance, object reflectance and colour percepts.
Left: The yellow and blue objects reflect the same quantity of light and appear equally bright to observers. However, due to the lower sensitivity of the retina to shorter wavelengths, the stimuli arising from the two objects elicit very different luminance signals. Right: A darker yellow object reflects less light but generates the same luminance signal as the blue object. It nonetheless appears less bright than the blue object.
Figure 7
Figure 7. Three example Gaussian spectral power distributions.
The standard deviation of the intensity (y-axis) of the three curves are the physical correlates of the perceived saturation of the corresponding spectra, with the highest on the left and the lowest on the right. The area under each curve (i.e. the reflectivity) is constant.

Similar articles

Cited by

References

    1. Fairchild MD. Color Appearance Models. 1st ed. Reading, , MS: Addison Wesley; 1998.
    1. Sharpe LT, Stockman A, Jagla W, Jägle H. A luminous efficiency function, V*(lambda), for daylight adaptation. J Vis. 2005;5:948–68. - PubMed
    1. Lennie P, Pokorny J, Smith VC. Luminance. J Opt Soc Am A. 1993;10:1283–1293. - PubMed
    1. Osorio D, Vorobyev M. Photoreceptor spectral sensitivities in terrestrial animals: adaptations for luminance and colour vision. Philos Trans R Soc Lond B Biol Sci. 2005;272:1745–1752. - PMC - PubMed
    1. Pridmore RW. Effects of luminance, wavelength and purity on the color attributes: Brief review with new data and perspectives. Color Research & Application. 2007;32:208–222.

Publication types