

Developmental toxicity of Ochratoxin A in rat embryo midbrain micromass cultures
- PMID: 19333434
- PMCID: PMC2662459
- DOI: 10.3390/ijms10010037
Developmental toxicity of Ochratoxin A in rat embryo midbrain micromass cultures
Abstract
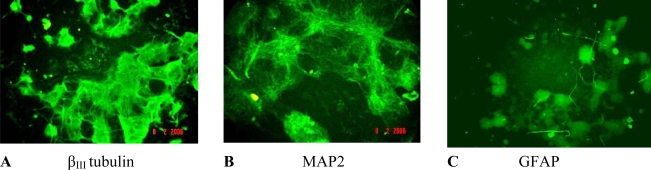
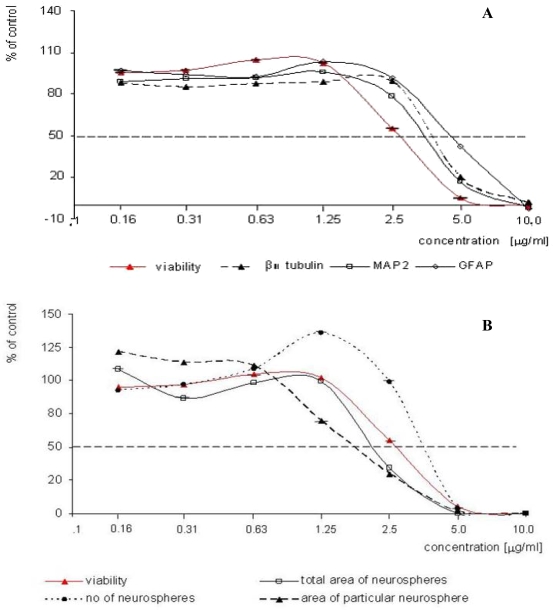
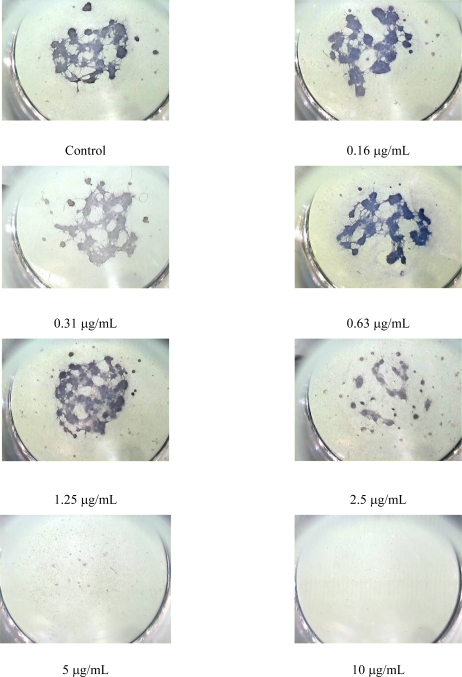
Embryonic midbrain micromass cultures were exposed for five days to ochratoxin A (OTA) at seven concentrations (ranging from 0.16 to 10 microg/mL). Cell viability was assessed in neutral red uptake test (NRU), and differentiation - by immunoenzymatic determination of structural proteins (beta(III)-tubulin, MAP2, GFAP) expression level as well as by computer image analysis. Dose dependent decrease in cell number and differentiation was observed. Concentration-response curves were analysed and the mean inhibition concentrations (microg/mL) for cytotoxicity (IC(50)) and differentiation (ID(50)) were calculated. There were no significant differences in the sensitivity of neurons in early and late stage of differentiation and astrocytes to the toxic activity of this compound. For all endpoints ID(50) value was very low (< 10 microg/mL) so OTA was classified as a strong teratogen. IC(50)/ ID(50) ratios <2 pointed out that with harmful action of OTA the basic cytotoxicity should be connected.
Keywords: Ochratoxin A; computer image analysis; developmental neurotoxicity; embryonic midbrain cells; immunocytochemistry; in vitro micromass cultures.
Figures
References
-
- Grandjean P, Lanndrigan PJ. Developmental neurotoxicity of industrial chemicals. Lancet. 2006;368:2167–2178. - PubMed
-
- Mendola P, Selevan SG, Gutter S, Rice D. Environmental factors associated with spectrum of neurodevelopmental deficits. Ment. Retard. Dev. Disabil. Res. Rev. 2002;8:188–197. - PubMed
-
- Ceccatelli S, Tamm R, Tofighi R, Johansson C. In vitro systems to study developmental neurotoxicity of food contaminants. Toxicol. Lett. 2006;164(suppl):24.
-
- Stoev SD. The role of ochratoxin A as a possible cause of Balkan endemic nephropathy and its risk evaluation. Vet. Hum. Toxicol. 1998;40:352–360. - PubMed
MeSH terms
Substances
LinkOut - more resources
Full Text Sources
Miscellaneous
