. 2009 Sep;94(3):333-49.
doi: 10.1007/s11060-009-9877-5. Epub 2009 Mar 31.

'Putting our heads together': insights into genomic conservation between human and canine intracranial tumors

Affiliations

'Putting our heads together': insights into genomic conservation between human and canine intracranial tumors

Rachael Thomas et al. J Neurooncol. 2009 Sep.

Abstract

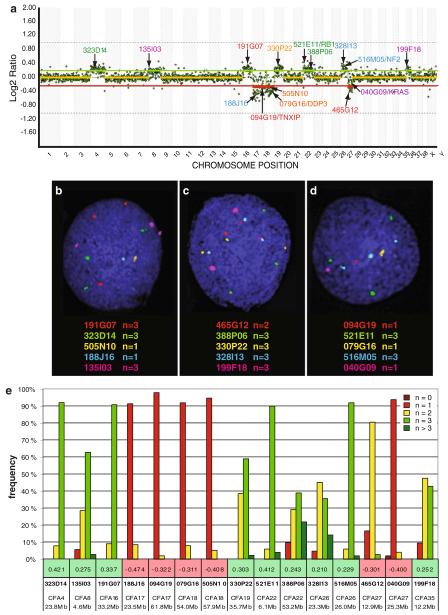
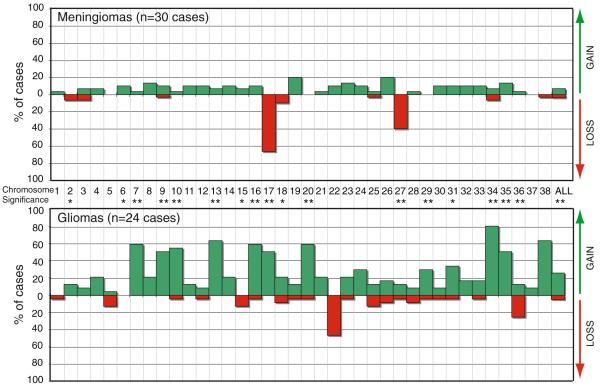
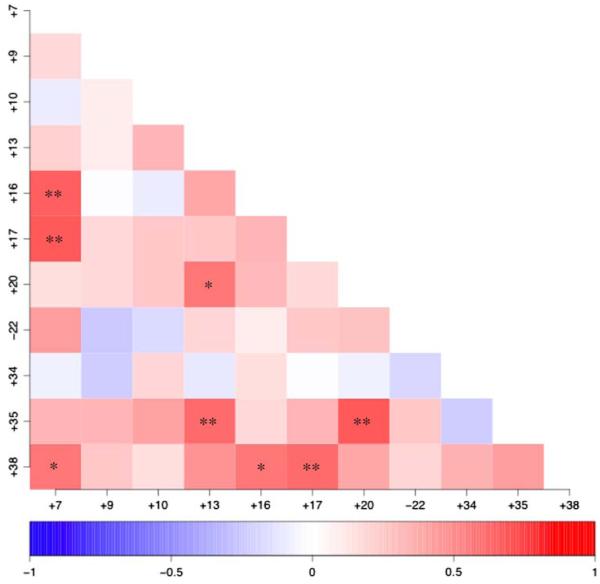
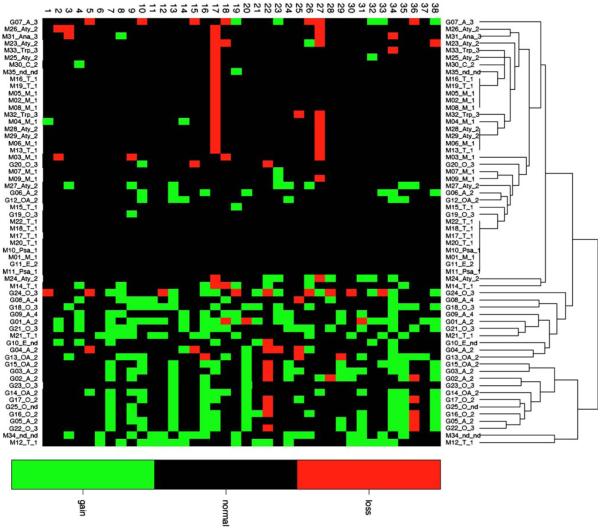
Numerous attributes render the domestic dog a highly pertinent model for cancer-associated gene discovery. We performed microarray-based comparative genomic hybridization analysis of 60 spontaneous canine intracranial tumors to examine the degree to which dog and human patients exhibit aberrations of ancestrally related chromosome regions, consistent with a shared pathogenesis. Canine gliomas and meningiomas both demonstrated chromosome copy number aberrations (CNAs) that share evolutionarily conserved synteny with those previously reported in their human counterpart. Interestingly, however, genomic imbalances orthologous to some of the hallmark aberrations of human intracranial tumors, including chromosome 22/NF2 deletions in meningiomas and chromosome 1p/19q deletions in oligodendrogliomas, were not major events in the dog. Furthermore, and perhaps most significantly, we identified highly recurrent CNAs in canine intracranial tumors for which the human orthologue has been reported previously at low frequency but which have not, thus far, been associated intimately with the pathogenesis of the tumor. The presence of orthologous CNAs in canine and human intracranial cancers is strongly suggestive of their biological significance in tumor development and/or progression. Moreover, the limited genetic heterogenity within purebred dog populations, coupled with the contrasting organization of the dog and human karyotypes, offers tremendous opportunities for refining evolutionarily conserved regions of tumor-associated genomic imbalance that may harbor novel candidate genes involved in their pathogenesis. A comparative approach to the study of canine and human intracranial tumors may therefore provide new insights into their genetic etiology, towards development of more sophisticated molecular subclassification and tailored therapies in both species.


Figures

Fig. 1
Fig. 1
a Example whole genome aCGH profile from analysis of a grade I meningioma from a 10 year old male Golden Retriever, co-hybridized with male reference DNA. Data are plotted as the median, block-normalized and background-subtracted log2 tumor DNA:reference DNA ratio of the replicate spots for each arrayed BAC clone. Log2 ratios representing genomic gain and loss are indicated by horizontal bars above (green line) and below (red line) the dashed midline (orange line) that represents normal copy number. The chromosome copy-number status line for the tumor appears as an orange overlay of the center-line when there is a normal copy number, and as either red (loss) or green (gain) in regions where genomic imbalances were apparent, as determined by the aCGH Smooth algorithm [24]. Here, chromosome gain is apparent for CFA 4, 8, 16, 19, 26 and 35. This case also shows the characteristic losses of CFA 17 and 27 that were highly recurrent in our dog meningioma panel, as well as loss of CFA 18. The aCGH profile is annotated with the clone address of 15 BAC clones from the 1 Mb array that were used in subsequent FISH analysis of this case. Five of these 15 clones have previously been shown to contain the full coding sequence of a key cancer-associated gene (TXNIP, DPP3, RB1, NF2, KRAS) [20]. The color of the text denotes the fluorochrome with which the BAC clone was labeled. bd Targeted FISH analysis of tumor interphase nuclei from the same case using 15 differentially labeled BAC clones (highlighted in a) combined in three separate groups. The modal copy number for each clone is indicated. e Summary of compiled copy number data based on FISH analysis of at least 30 tumor interphase nuclei for each of the 15 BAC clones. The number immediately above each BAC address represents the log2 tumor DNA:reference DNA ratio of the corresponding clone derived from the aCGH analysis. It is evident that the SLP data and the aCGH data are mutually confirmatory
Fig. 2
Fig. 2
Incidence of recurrent chromosome copy number changes in a meningiomas (n = 30 cases) and b gliomas (n = 24 cases). Tumors displaying a normal copy number throughout the genome were excluded from analysis. Each dog autosome is listed along the x-axis, and the y-axis indicates the percentage of the corresponding tumor population that showed copy number gain (green bar above the x-axis) or loss (red bar below the x-axis). The rightmost bars (x = ‘ALL’) show the mean incidence of copy number gain and loss across all chromosomes. Asterisks along the x-axis indicate those chromosomes for which the incidence of recurrent copy number gain or loss differed significantly between the meningiomas and glioma cases analyzed in the present study (* indicates p < 0.05, ** indicates p < 0.01)
Fig. 3
Fig. 3
Correlation analysis of recurrent chromosome aberration in gliomas. Cases were scored according to the presence or absence of each pairwise combination of the 11 chromosome aberrations that were observed in ≥40% of the glioma population. The degree of correlation between aberrations is indicated on a scale of red (positive correlation) ↔ blue (negative correlation). Asterisks indicate pairwise combinations of chromosome aberrations that show significantly strong association i.e. they occur at a frequency that is significantly different from that predicted on the basis of their individual frequency in the population (* indicates p < 0.02, ** indicates p < 0.01)
Fig. 4
Fig. 4
Unsupervised cluster analysis of all 60 tumors by chromosome copy number status. All cases are scored according to copy number status (gain = green, black = balanced, red = loss) for all 38 autosomes (horizonatl axis). Each case is denoted according to the tumor type along the vertical axis (G glioma, M meningioma), the histological subtype of the tumor (A astrocytoma, E ependymoma, OA oligoastrocytoma, O oligodendroglioma, Ang angiomatous, M meningothelial, Psa psammomatous, T transitional, C chordoid, Ana anaplastic, Aty atypical, Pap papillary, TrP transitional/papillary, nd not determined) and the clinical grade of the tumor. The panel of cases grossly subdivides into meningiomas and gliomas, with those cases showing a grossly normal karyotype clustered in the center of the figure

References

    1. Ries L, Melbert D, Krapcho M, Stinchcomb D, Howlader N, Horner M, Mariotto A, Miller B, Feuer E, Altekruse S, Lewis D, Clegg L, Eisner M, Reichman M, Edwards BK. SEER cancer statistics review, 1975–2005. National Cancer Institute; Bethesda, MD: 2008. http://seer.cancer.gov/csr/1975_2005/, based on November 2007 SEER data submission, posted to the SEER web site.
    1. Soffietti R, Ruda R. Neuro-oncology: new insights and advances in treatment. Lancet Neurol. 2008;7:14–16. doi:10.1016/S1474-4422(07)70305-8. - PubMed
    1. Collins VP. Brain tumours: classification and genes. J Neurol Neurosurg Psychiatry. 2004;75(Suppl 2):ii2–ii11. doi:10.1136/jnnp.2004.040337. - PMC - PubMed
    1. Koschny R, Koschny T, Froster UG, Krupp W, Zuber MA. Comparative genomic hybridization in glioma: a meta-analysis of 509 cases. Cancer Genet Cytogenet. 2002;135:147–159. doi:10.1016/S0165-4608(01)00650-1. - PubMed
    1. van Tilborg AA, Al Allak B, Velthuizen SC, de Vries A, Kros JM, Avezaat CJ, de Klein A, Beverloo HB, Zwarthoff EC. Chromosomal instability in meningiomas. J Neuropathol Exp Neurol. 2005;64:312–322. - PubMed

Publication types

MeSH terms