. 2009 Mar;65(3):316-25.
doi: 10.1002/ana.21594.

Declined neural efficiency in cognitively stable human immunodeficiency virus patients

Affiliations

Declined neural efficiency in cognitively stable human immunodeficiency virus patients

Thomas Ernst et al. Ann Neurol. 2009 Mar.

Abstract

Objective: To determine whether brain activation changes in clinically and neurocognitively normal human immunodeficiency virus (HIV)-infected and in HIV-seronegative control (SN) participants over a 1-year period.

Methods: Functional magnetic resonance imaging (fMRI) was performed in 32 SN and 31 HIV patients (all with stable combination antiretroviral treatment) at baseline and after 1 year. Each participant performed a set of visual attention tasks with increasing attentional load (from tracking two, three, or four balls). All HIV and SN participants had normal neuropsychological function at both examinations.

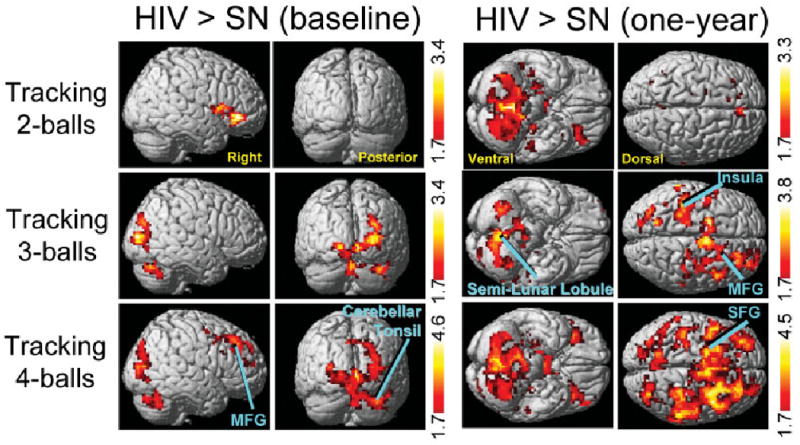
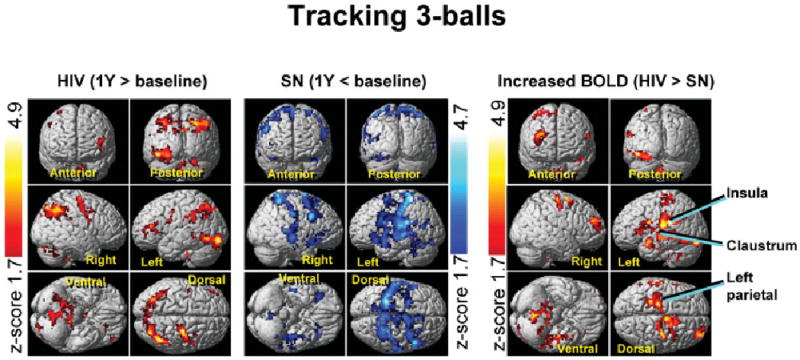
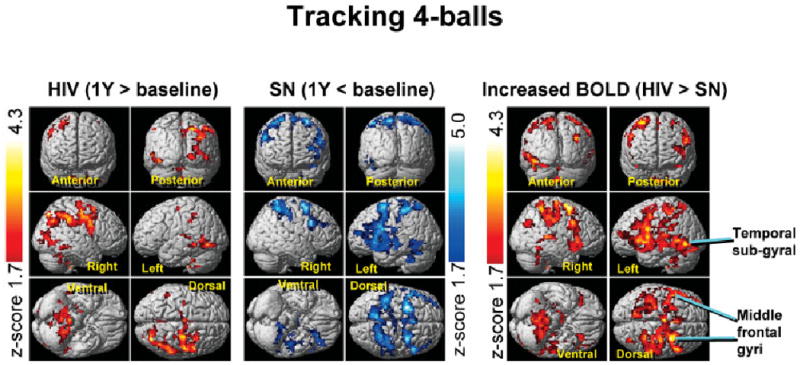
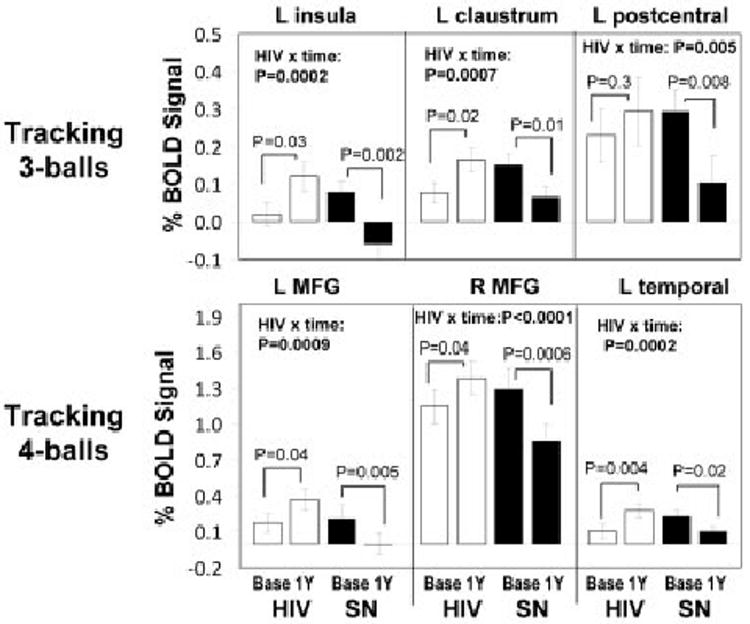
Results: Over 1 year, HIV patients showed no change in their neurocognitive status or in task performance during fMRI. However, HIV patients showed significant 1-year increases in fMRI signals in the prefrontal and posterior parietal cortices for the more difficult tasks, whereas SN control participants showed only decreases in brain activation in these regions. This resulted in significant interactions between HIV status and time of study in left insula, left parietal, left temporal, and several frontal regions (left and right middle frontal gyrus, and anterior cingulate).

Interpretation: Because fMRI task performance remained unchanged in both groups, the HIV patients appeared to maintain performance by increasing usage of the attention network, whereas the control participants reduced usage of the attention network after 1 year. These findings suggest improved efficiency or a practice effect in the SN participants but declined efficiency of the neural substrate in HIV patients, possibly because of ongoing brain injury associated with the HIV infection, despite their apparent stable clinical course.


Conflict of interest statement

Potential conflict of interest: Nothing to report.

Figures

Fig 1
Fig 1
Statistical parametric maps showing significantly greater brain activation in human immunodeficiency virus (HIV) than seronegative (SN) participants (unpaired t test) for the two- (top), three- (middle), and four-ball tasks (bottom) at the baseline examination (left) and 1-year follow-up (right). Compared with SN participants, the HIV group showed significantly greater activation only with the 4-ball task at baseline [cluster maxima: medial frontal gyrus (MFG: 18, 30, 27), p corrected < 0.0001, 2,149 voxels; cerebellar tonsil/occipital (36, −63, −33), p corrected < 0.02, 1,446 voxels)], but with all 3 tasks at the 1-year time point [2 balls: large cluster with maximum at claustrum (−21, 24, 9), p corrected < 0.0001, 6,416 voxels (only cerebellar activation visible); 3 balls: MFG (6, −3, 60), p corrected < 0.002, 1,813 voxels; insula (−36, −27, 21), p corrected < 0.008, 1,403 voxels; and cerebellar semilunar lobule (0, −63, −36), p corrected < 0.0001, 1,894 voxels; 4 balls: large cluster with maximum at superior frontal gyrus (SFG, −9, 6, 69), p corrected < 0.0001, 16,612 voxels]. Z-scores shown in the red-yellow color bars indicate significance (p < 0.05) at the voxel level. Labeled clusters are significant after correction for multiple comparisons (cluster level, p < 0.05), whereas unlabeled clusters were significant at the voxel level (p < 0.05), all clusters greater than 300 voxels.
Fig 2
Fig 2
Statistical parametric maps of changes in brain activation over the course of 1 year for human immunodeficiency virus (HIV)–positive (left) and seronegative (SN) controls (center) for the three-ball tracking task. Significant blood oxygen level dependent (BOLD) signal increases are indicated by Z-scores shown in the red-yellow scale and decreases by Z-scores on the blue-white scale. The HIV group shows only increases in brain activation, whereas the controls show only signal decreases after 1 year. The opposite changes led to significant interactions in brain activation between HIV status and time, with greater 1-year BOLD signal increases in HIV patients compared with SN controls (right). These findings suggest a practice effect in the controls but neural compensation in the HIV group to maintain performance. Clusters with greater than 300 voxels and p corrected < 0.05 (voxel level) are shown.
Fig 3
Fig 3
Statistical parametric maps of changes in brain activation over the course of 1 year for human immunodeficiency virus (HIV)–positive (left) and seronegative (SN) participants (center) for the four-ball tracking task. HIV patients showed greater BOLD signal increases at 1 year compared with SN participants (right). Clusters with greater than 300 voxels and p corrected < 0.05 (voxel level) are shown.
Fig 4
Fig 4
(top) Extracted blood oxygen level dependent (BOLD) signal amplitudes centered at 3 major cluster maxima that showed interaction effects for human immunodeficiency virus (HIV) status and time for the 3-ball tracking task: left insula (−36, −27, 21), left claustrum (−20, 3, 18), and left postcentral gyrus (−57, −21, 24). (bottom) Extracted BOLD signal amplitudes centered at three major cluster maxima that showed an interaction effect of HIV status and time for the 4-ball tracking task: left middle frontal gyrus (L MFG: −51, 30, 24), right middle frontal gyrus (R MFG: 33, 6, 63), and left temporal subgyral (−48, −48, −6). The extracted data confirm the findings of the Statistical Parametric Mapping analysis, with significant (p corrected < 0.005) HIV status × time interactions, using repeated-measure analysis of variance. Post hoc paired t tests were used to compare baseline and 1-year data in each group.

References

    1. Gray F, Adle-Biassette H, Chretien F, et al. Neuropathology and neurodegeneration in human immunodeficiency virus infection Pathogenesis of HIV-induced lesions of the brain, correlations with HIV-associated disorders and modifications according to treatments. Clin Neuropathol. 2001;20:146–155. - PubMed
    1. Janssen RS, Cornblath DR, Epstein LG, et al. Nomenclature and research case definitions for neurologic manifestations of human immunodeficiency virus-type 1 (HIV-1) infection. Neurology. 1991;41:778–785. - PubMed
    1. Dore GJ, McDonald A, Li Y, et al. Marked improvement in survival following AIDS dementia complex in the era of highly active antiretroviral therapy. AIDS. 2003;17:1539–1545. - PubMed
    1. Ghafouri M, Amini S, Khalili K, Sawaya BE. HIV-1 associated dementia: symptoms and causes. Retrovirology. 2006;3:28. - PMC - PubMed
    1. McArthur JC, Haughey N, Gartner S, et al. Human immunodeficiency virus-associated dementia: an evolving disease. J Neurovirol. 2003;9:205–221. - PubMed

Publication types