. 2009 Jun 30;161(2):538-53.
doi: 10.1016/j.neuroscience.2009.03.058. Epub 2009 Mar 29.

Substance P release and neurokinin 1 receptor activation in the rat spinal cord increase with the firing frequency of C-fibers

Affiliations

Substance P release and neurokinin 1 receptor activation in the rat spinal cord increase with the firing frequency of C-fibers

D Adelson et al. Neuroscience. .

Abstract

Both the firing frequency of primary afferents and neurokinin 1 receptor (NK1R) internalization in dorsal horn neurons increase with the intensity of noxious stimulus. Accordingly, we studied how the pattern of firing of primary afferent influences NK1R internalization. In rat spinal cord slices, electrical stimulation of the dorsal root evoked NK1R internalization in lamina I neurons by inducing substance P release from primary afferents. The stimulation frequency had pronounced effects on NK1R internalization, which increased up to 100 Hz and then diminished abruptly at 200 Hz. Peptidase inhibitors increased NK1R internalization at frequencies below 30 Hz, indicating that peptidases limit the access of substance P to the receptor at moderate firing rates. NK1R internalization increased with number of pulses at all frequencies, but maximal internalization was substantially lower at 1-10 Hz than at 30 Hz. Pulses organized into bursts produced the same NK1R internalization as sustained 30 Hz stimulation. To determine whether substance P release induced at high stimulation frequencies was from C-fibers, we recorded compound action potentials in the sciatic nerve of anesthetized rats. We observed substantial NK1R internalization when stimulating at intensities evoking a C-elevation, but not at intensities evoking only an Adelta-elevation. Each pulse in trains at frequencies up to 100 Hz evoked a C-elevation, demonstrating that C-fibers can follow these high frequencies. C-elevation amplitudes declined progressively with increasing stimulation frequency, which was likely caused by a combination of factors including temporal dispersion. In conclusion, the instantaneous firing frequency in C-fibers determines the amount of substance P released by noxious stimuli.


Figures

Fig. 1
Fig. 1. Effect of intensity of stimulation
The dorsal root of spinal cord slices was stimulated with 300 pulses of the intensities indicated (0.4 ms duration) delivered at 30 Hz. NK1R internalization was measured in lamina I ipsilateral and contralateral to the stimulated root. Points are the mean ± SEM of three slices. Two-way repeated measures ANOVA indicated a significant effect (p<0.0001) of the variables “intensity” and “side” (ipsilateral vs. contralateral), as well as their interaction (p=0.0004). Bonferroni’s post-hoc test: ** p<0.01, *** p<0.001, compared with contralateral.
Fig. 2
Fig. 2. Confocal imagesof NK1R neurons after dorsal root stimulation with different intensities
The dorsal root of spinal cord slices was stimulated with pulses of 0.4 ms and 5–20 V delivered at 30 Hz. Images were taken in the coronal plane, and are from neurons in lamina I (except F, lamina IV) ipsilateral to the stimulated root (except A, contralateral). Dorsal side is up. A. Contralateral dorsal horn (stimulus was 1000 pulses of 20 V); there is no NK1R internalization. B. Stimulus was 300 pulses of 5 V; there is little NK1R internalization. C, D. Stimulus was 300 pulses of 10 V; there is NK1R internalization, but more marked in D than in C. E. Stimulus was 300 pulses of 20 V; there is abundant NK1R internalization. F. Lamina IV neurons ipsilateral to a root stimulated with 300 pulses of 20 V; there is no NK1R internalization. Image in F was taken with a 63x objective and consist of 7 optical sections separated 0.61 μm. Other images were taken with a 100x objective and consist of 3 (A, B) or 4 (C–E) optical sections separated by 0.57 μm. All images were deblurred using deconvolution. Scale bars are 10 μm.
Fig. 3
Fig. 3. NK1R internalization evoked by dorsal root stimulation was abolished by a NK1R antagonist, low Ca2+ or lidocaine
The dorsal root of spinal cord slices was stimulated with 1000 pulses (0.4 ms, 20 V) at 100 Hz while the slices were superfused with aCSF alone (control), 10 μM L-703,606 (NK1R antagonist), low Ca2+ (0.2 mM CaCl2) or 1 mM lidocaine. Superfusion with L-703,606 started 40 min before stimulation. N is indicated by the numbers next to the bars. Two-way ANOVA showed significant effects (p<0.0001) for the variables “drugs” and “side” (ipsilateral vs. contralateral) and their interaction. Bonferroni’s post-hoc test: *** p<0.001 compared to control ipsilateral; differences between ipsilateral and contralateral were significant (p<0.001) for control, not significant for L-703,606, low Ca2+ and lidocaine.
Fig. 4
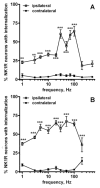
Fig. 4. Effect of stimulation frequency
The dorsal root of spinal cord slices was stimulated with 1000 pulses of 0.4 ms and 20 V delivered at the frequencies indicated. The slices were superfused with aCSF alone (A) or with peptidase inhibitors (10 μM thiorphan and 10 μM captopril, B), starting 5 min before and ending 10 after stimulation. NK1R internalization was measured in lamina I ipsilateral and contralateral to the root. Points are the mean ± SE of 3–5 slices. For each panel, a two-way ANOVA yielded significant effects of the variables “frequency” (p<0.0003) and “side” (ipsilateral vs. contralateral, p<0.0001), as well as their interaction (p<0.0001). Bonferroni’s post-hoc tests: * p<0.05, ** p<0.01, *** p<0.001 compared with the contralateral side.
Fig. 5
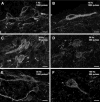
Fig. 5. NK1R neurons after dorsal root stimulation with different frequencies and number of pulses
The dorsal root was stimulated with 30, 300 or 1000 pulses (0.4 ms, 20 V) delivered at the indicated frequencies. Images are from lamina I neurons ipsilateral to the stimulated root (coronal plane). Dorsal side is up. A. Stimulus was 1000 pulses at 1 Hz; the rightmost neuron in this cluster shows some NK1R internalization. B. Stimulus was 1000 pulses at 10 Hz; this neuron shows both NK1R internalization and surface staining. C. Stimulus was 30 pulses at 30 Hz; these three neurons do not have NK1R internalization. D. Stimulus was 300 pulses at 30 Hz; all the neurons show extensive NK1R internalization and little surface staining. E. Stimulus was 1000 pulses at 30 Hz; the two neurons show abundant NK1R internalization and little surface staining. F. Stimulus was 300 pulses at 100 Hz; this neuron shows extensive NK1R internalization. Images were taken with a 100x objective and consist of 4 (A, B, D, F) or 5 (C, E) optical sections separated 0.57 μm. All images were deblurred using deconvolution. Scale bars are 10 μm.
Fig. 6
Fig. 6. Dependence of NK1R internalization on the number of pulses at different frequencies and stimulation patterns
The dorsal root was stimulated with 10–1000 pulses (0.4 ms, 20 V) delivered using four different stimulation patterns: 1) single train at 1 Hz, 2) single train at 10 Hz, 3) single train at 30 Hz, 4) “theta burst stimulation” (TBS), consisting in multiple trains (bursts) of 4 pulses at 100 Hz, with inter-burst frequency of 5 Hz (every 0.2 sec). NK1R internalization was measured in lamina I of the ipsilateral dorsal horn. In the contralateral dorsal horn, NK1R internalization was low (<15% NK1R neurons with internalization, not shown). Points are the mean ± SE of 3 slices. Curves represent fitting by non-linear regression of a sigmoidal dose-response function to the data points, which produced the following parameter values: 1) 1 Hz: top = 29 ± 4 %, EC50 = 115 pulses (95% CI, 16–800 pulses), 2) 10 Hz: top = 47 ± 6 %, EC50 = 171 pulses (95% CI, 39–747 pulses), 3) 30 Hz: top = 78 ± 5 %, EC50 = 280 pulses (95% CI, 162–481 pulses), 4) TBS: top = 79 ± 5 %, EC50 = 217 pulses (95% CI, 115–411 pulses). The ‘bottom’ parameter was assumed to be equal to the average value obtained contralaterally (6.35%) and kept constant for non-linear regression.
Fig. 7
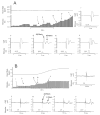
Fig. 7. Determination of thresholds to evoke Aδ- and C-fiber CAPs
CAPs were recorded from the tibial branch of the sciatic nerve of a rat. They were evoked with a stimulating electrode placed 29 mm distal from the recording electrode. Stimuli were applied at 1 Hz. In each panel, the upper traces plot the heart rate during the stimulation and the lower traces the amplitude of electrical stimuli. Insets show examples of CAPs evoked by the stimuli indicated by the arrows and the corresponding roman numerals. A. Threshold for the Aδ-fiber CAP. A well-developed Aβ-fiber CAP (truncated) was evoked with the lower stimulation intensity (0.1 V, i). The Aδ-fiber CAP (peak at a conduction velocity of 6.5 m/s) appeared with pulses of 0.4 V and increased with pulses up to 1.0 V. B. Threshold for the C-fiber CAP. The C-fiber CAP (conduction velocity centered around 0.86 m/s) appeared with pulses of 3 V and increased with pulses up to 10 V. At 1 Hz stimulation, heart rate increased with pulse intensities higher than 6 V.
Fig. 8
Fig. 8. C-fiber CAPs evoked by sciatic nerve stimulation at different frequencies
The tibial branch of the sciatic nerve was stimulated at the indicated frequencies with pulses of a constant intensity of 21 V, 7 times the C-fiber threshold. All traces are from the same rat and were taken a few minutes apart. The latencies of the CAPs are indicated under the arrows linking each pulse with the CAP it evoked. For each series, the upper trace shows the CAP and the lower trace the stimulus monitor output. Traces at 1–50 Hz were recorded by increasing the frequency every 5–7 s. The amplitude of the C-fiber elevation remained stable during stimulation at each rate, but decreased as the frequency was increased. At 40 Hz and higher frequencies, the CAP was recorded after the stimulus artifact of the next pulse. At 100 Hz, successive CAPs interfere with each other. Because of that, a CAP evoked by a single pulse was recorded 500 ms after the end of the 100 Hz train in order to measure its latency and amplitude.
Fig. 9
Fig. 9. NK1R internalization evoked by sciatic nerve stimulation
The tibial branch of the left sciatic nerve of a rat was mounted on recording and stimulating electrodes, and the Aδ- and C-fiber thresholds were determined as shown in Fig. 7. The stimulating electrode was placed distal and the recording electrode proximal to the spinal cord (in “C-fiber*” the electrode position was reversed). One hour after threshold determination, the following stimuli were delivered: “sham”, no stimulation; “Aδ-fiber”, 300 pulses of intensity 1.5 times the Aδ-fiber threshold (but sub-threshold for C-fibers); “C-fiber” and “C-fiber*”, 300 pulses of intensity 1.5 times the C-fiber threshold. Pulse duration was 0.4 ms, and the frequency was 30 Hz. The rat was fixed 10 min afterwards, and the L3-L5 spinal segment was processed for NK1R immunohistochemistry. NK1R internalization was measured in lamina I. Data are the mean ± SEM. The number of rats (N) is given inside the bars. Two-way ANOVA revealed overall significance (p<0.0001) for the variables “pulse intensity” and “side”. Bonferroni’s post-hoc test: *** p<0.001 compared with “sham” ipsilateral, ††† p<0.001 (as indicated).
Fig. 10
Fig. 10. NK1R neurons after sciatic nerve stimulation
Images from coronal sections of the lumbar spinal cord (L3-L5) showing NK1R neurons in lamina I after sciatic nerve stimulation. A. Sham (electrodes placed on the nerve, but no current passed) produced no NK1R internalization. B. Stimulation at 1.5x Aδ-fiber threshold but sub-threshold for C-fibers (300 pulses at 30 Hz) produced no NK1R internalization. C. Stimulation at 1.5x C-fiber threshold (300 pulses at 30 Hz) produced NK1R internalization. D. Dorsal horn contralateral to the sciatic nerve stimulated at C-fiber intensity; no NK1R internalization is observed. Main panels images were taken with a 20x objective (scale bar is 50 μm), and consist of three optical sections separated 1.22–1.91 μm. Inset images were taken with a 100x objective (scale bars are 10 μm) and consist of 6 (A), 5 (B, C) or 4 (D) optical sections separated 0.61 μm.

References

    1. Abbadie C, Trafton J, Liu H, Mantyh PW, Basbaum AI. Inflammation increases the distribution of dorsal horn neurons that internalize the neurokinin-1 receptor in response to noxious and non-noxious stimulation. J Neurosci. 1997;17:8049–8060. - PMC - PubMed
    1. Adelson DW, Wei JY, Kruger L. H2O2 sensitivity of afferent splanchnic C fiber units in vitro. J Neurophysiol. 1996;76:371–380. - PubMed
    1. Adelson DW, Wei JY, Kruger L. Warm-sensitive afferent splanchnic C-fiber units in vitro. J Neurophysiol. 1997;77:2989–3002. - PubMed
    1. Allen BJ, Li J, Menning PM, Rogers SD, Ghilardi J, Mantyh PW, Simone DA. Primary afferent fibers that contribute to increased substance P receptor internalization in the spinal cord after injury. J Neurophysiol. 1999;81:1379–1390. - PubMed
    1. Allen BJ, Rogers SD, Ghilardi JR, Menning PM, Kuskowski MA, Basbaum AI, Simone DA, Mantyh PW. Noxious cutaneous thermal stimuli induce a graded release of endogenous substance P in the spinal cord: imaging peptide action in vivo. J Neurosci. 1997;17:5921–5927. - PMC - PubMed

Publication types