. 2009 May;37(8):e65.
doi: 10.1093/nar/gkp193. Epub 2009 Mar 30.

Real-time monitoring of aRNA production during T7 amplification to prevent the loss of sample representation during microarray hybridization sample preparation

Affiliations

Real-time monitoring of aRNA production during T7 amplification to prevent the loss of sample representation during microarray hybridization sample preparation

Isabelle Gilbert et al. Nucleic Acids Res. 2009 May.

Abstract

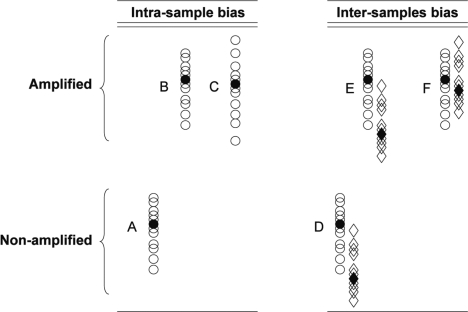
Gene expression analysis performed through comparative abundance of transcripts is facing a new challenge with the increasing need to compare samples of known cell number, such as early embryos or laser microbiopsies, where the RNA contents of identical cellular inputs can by nature be variable. When working with scarce tissues, the success of microarray profiling largely depends on the efficiency of the amplification step as determined by its ability to preserve the relative abundance of transcripts in the resulting amplified sample. Maintaining this initial relative abundance across samples is paramount to the generation of physiologically relevant data when comparing samples of different RNA content. The T7 RNA polymerase (T7-IVT) amplification is widely used for microarray sample preparation. Characterization of the reaction's kinetics has clearly indicated that its true linear phase is of short duration and is followed by a nonlinear phase. This second phase leads to modifications in transcript abundance that biases comparison between samples of different types. The impact assessment performed in this study has shown that the standard amplification protocol significantly lowers the quality of microarray data, rendering more than half of differentially expressed candidates undetected and distorting the true proportional differences of all candidates analyzed.


Figures

Figure 1.
Figure 1.
Schematic representation of the two potential biases that need to be considered when using an amplification step to produce relevant microarray data. Open circles represent individual expressed sequence tags (ESTs) that are distributed according to their relative proportions (higher position meaning more abundant). Columns A–C represent the intrasample bias where A: the original unamplified distribution; B: the amplified output with original proportions kept; and C: is the amplified output that harbors skews in the relative representations between ESTs. Columns D–F represent the intersample bias where D: relative distributions of the two original samples; E: amplified outputs with kept proportions between samples; and F: amplified outputs with skewed relative proportions between the samples but intact relative proportions within samples.
Figure 2.
Figure 2.
Schematic representation of the broken beacon. The fluorescent oligonucleotide (fluo-oligo) forms a duplex with the quencher oligonucleotide (quencher-oligo); the proximity of the fluorophore and the quencher prevents fluorescence emission. In the presence of the target sequence, the quencher-oligo is displaced, allowing the fluo-oligo to emit.
Figure 3.
Figure 3.
Characterization of the kinetics of each T7-IVT amplification round. Two tissues were tested, i.e. germinal-stage oocytes and 8-cell embryos. (A) The aRNA production during the first round was followed using real-time PCR targeting the actin gamma 1 (ACTG1) and high-mobility group box 1 (HmgB1) transcripts. (B) The aRNA production during the second round was followed by measuring the incorporation of radiolabeled UTP.
Figure 4.
Figure 4.
Total RNA micro-electrophoretic profiles of first-round and second-round T7-IVT aRNA outputs. S = seconds and FU = Fluorescent units. M = spiked in marker.
Figure 5.
Figure 5.
Standard curve of fluorescence emitted by the broken beacon versus concentration of the single-stranded antisense actin beta (ACTB) target.
Figure 6.
Figure 6.
(A and B) Fluorescence history charts of real-time monitoring of the amplification reaction using the broken beacon. Both rounds were monitored in both sample types, i.e. GV oocytes and 8-cell embryos.
Figure 7.
Figure 7.
Venn diagrams highlighting the proportional overlaps and divergences in gene lists of ESTs with significant abundance difference between both amplification protocols [standard (6 h) versus restricted (X h)]. In both cases, the candidates selected were those that were more prevalent in (A) the GV oocyte or (B) the 8-cell embryo.
Figure 8.
Figure 8.
Relative abundance of candidate gene transcripts in unamplified or amplified samples following the restricted amplification protocol (identified on the charts by ‘xh’) or following the standard procedures (two rounds of 6 h) identified by ‘6h’. For each group, the mean abundance value of the GV oocyte was set as standard relative basis. CCNB1, cyclin B1; DDX5, DEAD box polypeptie 5; DENR, density-regulated protein; GAPDH, glyceraldehyde-3-phosphate dehydrogenase; KLF10, Kruppel-like factor 10; LDHB, lactate dehydrogenase B; NLRP9, NLR family, pyrin domain containing 9; OLFML1, olfactomedin-like 1; PABPC1, poly(A)-binding protein cytoplasmic 1; PTTG1, pituitary tumor-transforming 1; SNW1, SNW domain containing 1; SVIL, supervillin.

Similar articles

Cited by

References

    1. Kurn N, Chen P, Heath JD, Kopf-Sill A, Stephens KM, Wang S. Novel isothermal, linear nucleic acid amplification systems for highly multiplexed applications. Clin. Chem. 2005;51:1973–1981. - PubMed
    1. Wellenreuther R, Schupp I, Poustka A, Wiemann S. SMART amplification combined with cDNA size fractionation in order to obtain large full-length clones. BMC Genomics. 2004;5:36. - PMC - PubMed
    1. Van Gelder RN, von Zastrow ME, Yool A, Dement WC, Barchas JD, Eberwine JH. Amplified RNA synthesized from limited quantities of heterogeneous cDNA. Proc. Natl Acad. Sci. USA. 1990;87:1663–1667. - PMC - PubMed
    1. Puskas LG, Zvara A, Hackler L, Jr, Van Hummelen P. RNA amplification results in reproducible microarray data with slight ratio bias. Biotechniques. 2002;32:1330–1334. 1336, 1338, 1340. - PubMed
    1. van Haaften RI, Schroen B, Janssen BJ, van Erk A, Debets JJ, Smeets HJ, Smits JF, van den Wijngaard A, Pinto YM, Evelo CT. Biologically relevant effects of mRNA amplification on gene expression profiles. BMC Bioinformatics. 2006;7:200. - PMC - PubMed

Publication types

MeSH terms