Inherent noise can facilitate coherence in collective swarm motion
- PMID: 19336580
- PMCID: PMC2667078
- DOI: 10.1073/pnas.0811195106
Inherent noise can facilitate coherence in collective swarm motion
Abstract
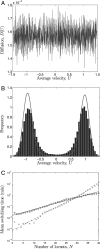
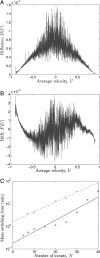
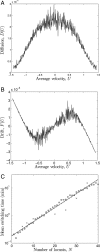
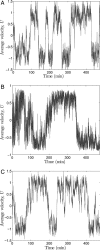
Among the most striking aspects of the movement of many animal groups are their sudden coherent changes in direction. Recent observations of locusts and starlings have shown that this directional switching is an intrinsic property of their motion. Similar direction switches are seen in self-propelled particle and other models of group motion. Comprehending the factors that determine such switches is key to understanding the movement of these groups. Here, we adopt a coarse-grained approach to the study of directional switching in a self-propelled particle model assuming an underlying one-dimensional Fokker-Planck equation for the mean velocity of the particles. We continue with this assumption in analyzing experimental data on locusts and use a similar systematic Fokker-Planck equation coefficient estimation approach to extract the relevant information for the assumed Fokker-Planck equation underlying that experimental data. In the experiment itself the motion of groups of 5 to 100 locust nymphs was investigated in a homogeneous laboratory environment, helping us to establish the intrinsic dynamics of locust marching bands. We determine the mean time between direction switches as a function of group density for the experimental data and the self-propelled particle model. This systematic approach allows us to identify key differences between the experimental data and the model, revealing that individual locusts appear to increase the randomness of their movements in response to a loss of alignment by the group. We give a quantitative description of how locusts use noise to maintain swarm alignment. We discuss further how properties of individual animal behavior, inferred by using the Fokker-Planck equation coefficient estimation approach, can be implemented in the self-propelled particle model to replicate qualitatively the group level dynamics seen in the experimental data.
Conflict of interest statement
The authors declare no conflict of interest.
Figures


References
-
- Couzin ID, Krause J. Self-organization and collective behavior in vertebrates. Adv Stud Behav. 2003;32:1–75.
-
- Sumpter DJT, Buhl J, Biro D, Couzin ID. Information transfer in moving animal groups. Theor Biosci. 2008;127:177–186. - PubMed
-
- Parrish JK, Viscido SV, Grunbaum D. Self-organized fish schools: An examination of emergent properties. Biol Bull. 2002;202(3):296–305. - PubMed
-
- Vicsek T. Fluctuations and Scaling in Biology. London: Oxford Univ Press; 2001.
-
- Vicsek T, Czirók A, Ben-Jacob E, Cohen I, Shochet O. Novel type of phase transition in a system of self-driven particles. Phys Rev Lett. 1995;75(6):1226–1229. - PubMed
Publication types
MeSH terms
Grants and funding
LinkOut - more resources
Full Text Sources
Medical

