. 2009;4(4):e5000.
doi: 10.1371/journal.pone.0005000. Epub 2009 Apr 1.

Regulation of T cell development and activation by creatine kinase B

Affiliations

Regulation of T cell development and activation by creatine kinase B

Yafeng Zhang et al. PLoS One. 2009.

Abstract

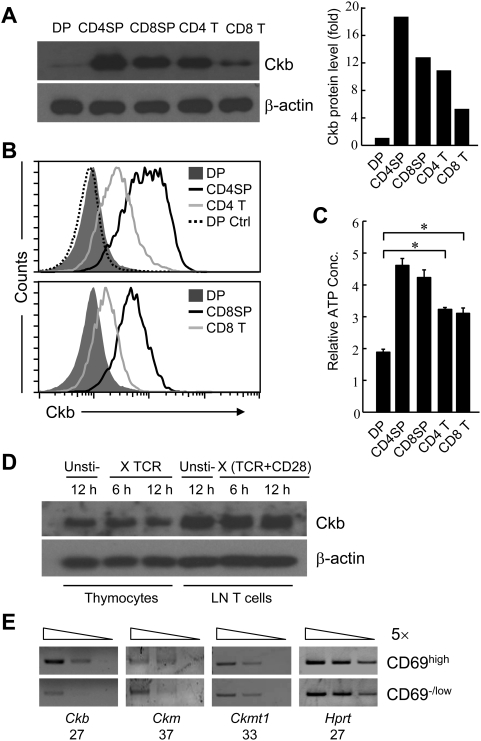
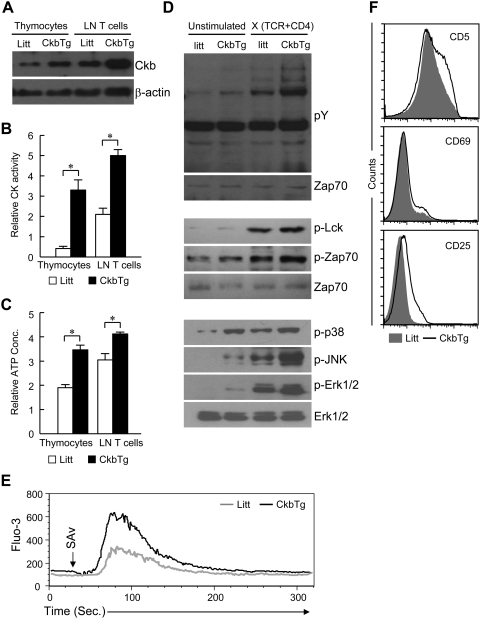
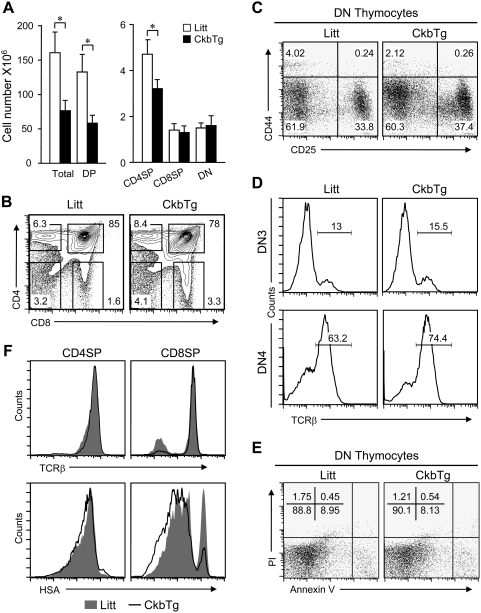
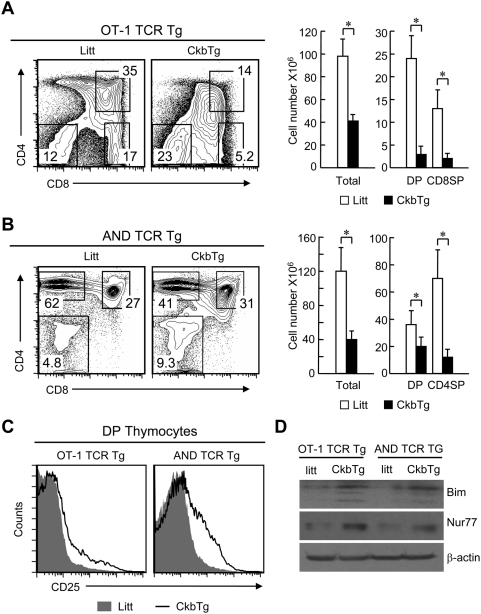
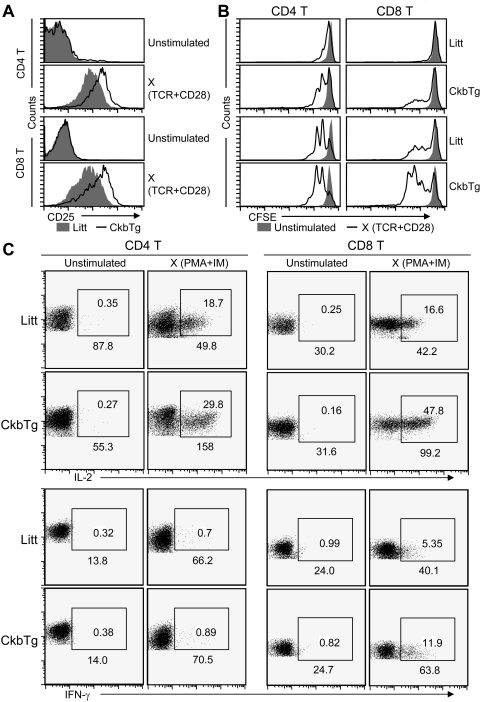
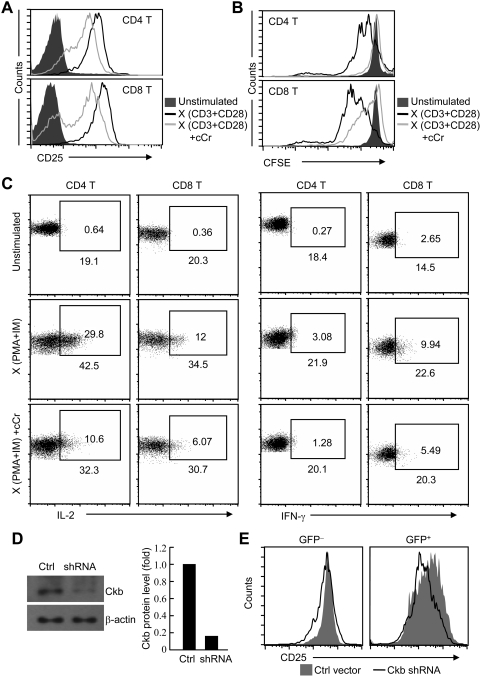
Creatine kinase catalyzes the reversible transfer of the N-phosphoryl group from phosphocreatine to ADP to generate ATP and plays a key role in highly energy-demanding processes such as muscle contraction and flagellar motility; however, its role in signal transduction (which frequently involves ATP-consuming phosphorylation) and consequent cell-fate decisions remains largely unknown. Here we report that creatine kinase B was significantly up-regulated during the differentiation of double-positive thymocytes into single-positive thymocytes. Ectopic expression of creatine kinase B led to increased ATP level and enhanced phosphorylation of the TCR signaling proteins. Consequentially, transgenic expression of creatine kinase B promoted the expression of Nur77 and Bim proteins and the cell death of TCR signaled thymocyte. In addition, the activation, proliferation and cytokine secretion of T cells were also enhanced by the expression of creatine kinase B transgene. In contrast, treatment of T cells with specific creatine kinase inhibitor or creatine kinase B shRNA resulted in severely impaired T cell activation. Taken together, our results indicate that creatine kinase B plays an unexpected role in modulating TCR-mediated signaling and critically regulates thymocyte selection and T cell activation.


Conflict of interest statement

Competing Interests: The authors have declared that no competing interests exist.

Figures

Figure 1
Figure 1. The expression profiles of Ckb in T-lineage cells.
(A) The expression of Ckb in purified cells was analyzed by immunoblot with a rabbit polyclonal antibody against Ckb and the optical density of the bands was quantified and normalized against that of β-actin. (B) Flow cytometric analysis of Ckb expression in thymocytes and T cells. DP thymocytes stained with pre-serum was used for negative control (DP Ctrl). (C) The relative intracellular ATP concentration was measured in purified DP, CD4SP, CD8SP thymocytes and CD4, CD8 T cells (*, P<0.05). (D) Total thymocytes and lymphocytes were stimulated with anti-TCR (10 µg/ml) or anti-TCR (10 µg/ml) and anti-CD28 (10 µg/ml) respectively for 6 h or 12 h or unstimulated (Unsti-) and then analyzed for Ckb expression. (E) RT-PCR analysis showed that only Ckb is differentially expressed during thymocyte development. CD69high and CD69−/low thymocytes were sorted from C57BL/6 mice. Bands resolved on agarose gels show PCR products by 5-fold serial dilution of cDNA (wedges), numbers of PCR cycles used for amplification were written underneath the gene name. ckmt2 was not detectable in these two subsets. All the results above are representative of three independent experiments.
Figure 2
Figure 2. Transgenic Ckb promotes ATP generation and augments TCR signal strength.
(A) Expression of Ckb protein was analyzed by immunoblot analysis of lysates from total thymocytes or lymphocytes, β-actin served as a loading control. (B) Creatine kinase activity in cell extracts was determined by using standard methods as described in Materials and Methods (*, P<0.05). (C) Detection of intracellular ATP concentration of beads-purified cells (*, P<0.05). (D) Analyses of phosphorylation of proteins involved in TCR signaling. FACS-purified DP thymocytes were left unstimulated or stimulated by anti-TCR plus anti-CD4 streptavidin-mediated crosslinking for 2 min, Shown on the top are tyrosine phosphorylation of total cellular proteins, membrane was stripped and reprobed for Zap70 as a loading control; Shown on the middle are tyrosine phosphorylation of Lck and Zap70, equal loading of the lanes was verified by anti-Zap70 immunoblotting; Phosphorylation of p38, JNK and Erk1/2 is shown on the bottom, membranes were stripped and reprobed for ERK1/2 as a loading control. (E) TCR-induced Ca2+ mobilization. Shown are the histograms of Ca2+ mobilization in control cells (gray line) and CkbTg (black line) DP thymocytes. Thymocytes were stimulated with biotin-conjugated anti-TCR and anti-CD4, cross-linked with streptavidin, and analyzed for Ca2+ mobilization. Arrows indicate the time points when straptavidin was added. (F) Flow cytometric analysis of the expression of CD5, CD69 and CD25 on DP thymocytes. The results are representative of three to four independent experiments. Litt, littermate; CkbTg, Ckb transgenic mouse.
Figure 3
Figure 3. Flow cytometric analysis of thymocyte populations.
(A) Comparison of thymocyte subsets in Ckb-transgenic mice and littermate controls. Bar graphs (error bars: SEM) indicate the average numbers of each thymocyte subset. The results were summarized from 4- to 5-week-old Ckb-transgenic mice (n = 5) and littermate control mice (n = 5) (*, P<0.05). (B) Dot plots indicate CD4 versus CD8 profiles of live thymocytes, numbers next to boxes indicate the percentage of cells in that box. (C) The relative distribution of DN subsets revealed by CD44 and CD25 staining. (D) Intracellular staining for TCRβ expression in DN3 and DN4 thymocytes, Numbers on the graphs represent the percentage of TCRβ positive cells. (E) Freshly isolated thymocytes were stained with anti-CD4 and anti-CD8, followed by dual-labeling for annexin V and PI and analyzed by flow cytometry, the percentages of cells within each quadrant are shown in the upper left quadrants. (F) Detection of TCR and HSA expression on CD4SP and CD8SP thymocytes from CkbTg mice and littermate controls. The results are representative of three to fiver independent experiments. Litt, littermate; CkbTg, Ckb transgenic mouse.
Figure 4
Figure 4. Transgenic expression of Ckb promotes premature death of DP thymocyte.
(A) Apoptotic and dead DP thymocytes were discriminated on the basis of a double-labeling for annexin V and PI and analyzed by flow cytometry, the percentages of cells within each quadrant are shown in the upper left quadrants. (B) Apoptotic DP thymocytes were measured by TUNEL assay (Ctrl, TUNEL reaction mixture without TdT enzyme solution; *, P<0.05). Thymocytes used in both (A) and (B) were freshly prepared. (C) Flow cytometric analysis of Bcl-2 expression in DP thymocytes. (D) Flow cytometric analysis of apoptotic CD69−/low and CD69high DP thymocytes from CkbTg mice and their littermate controls using Annexin V and PI staining. The percentages of cells within each quadrant are shown in the upper left quadrants, N/A, not applicable. (E) Immunoblot analysis of Bim and Nur77 expression in FACS-sorted CD69−/low and CD69high DP thymocytes, β-actin served as a loading control. (F) Thymocytes were stimulated with different concentrations of plate-bound anti-TCR and anti-CD28 antibodies for 12 h and then used for apoptotic analysis (Top, anti-TCR (H57-597) 1 µg/ml, anti-CD28 (37.51) 1 µg/ml. Bottom, anti-TCR (H57-597) 10 µg/ml, anti-CD28 (37.51) 10 µg/ml), the percentages of cells within each quadrant are shown in the upper left quadrants. Data are representative of three independent experiments. Litt, littermate; CkbTg, Ckb transgenic mouse.
Figure 5
Figure 5. Ectopic expression of Ckb impairs thymic positive selection.
(A, B) Dot plots indicate CD4 versus CD8 profiles of total thymocytes from TCR transgenic or Ckb and TCR double transgenic mice, numbers next to boxes indicate the percentage of cells in that box. The cell numbers of total thymocytes or different subsets are shown on the right. (A), MHC Class I restricted OT-1 TCR transgenic; (B) MHC Class II restricted AND TCR transgenic (*, P<0.05). (C) Detection of surface CD25 expression on DP thymocytes. (D) Immunoblot analysis of Bim and Nur77 expression in total thymocytes, β-actin served as a loading control. Litt, littermate; CkbTg, Ckb transgenic mouse.
Figure 6
Figure 6. Ecotopic expression of Ckb enhances TCR sensitivity and T cell response.
(A) Flow cytometric analysis of the activation marker CD25 on CD4 and CD8 T cells, cells were stimulated with plate-bound anti-TCR (10 µg/ml) and anti-CD28 (10 µg/ml) antibodies or left unstimulated for 16 h. (B) CFSE-labeled lymphocytes were stimulated with plate-bound anti-TCR (top 0.5 µg/ml, bottom 2 µg/ml) and anti-CD28 antibodies (top 0.5 µg/ml, bottom 2 µg/ml) or left unstimulated. Cells aliquots were analyzed for CFSE fluorescence as an indicator of cell division. Analyses were gated on CD4+ or CD8+ cells as indicated. (C) Analysis of cytokine expression. LN T cells were isolated from 6-week-old CkbTg and Littermate mice, left unstimulated or stimulated with PMA and IM for 4 h and then analyzed for CD4, CD8, IL-2 and IFN-γ expression. Values in the gating boxes indicate the percentage of IL-2+ or IFN-γ+ cells and numbers underneath the gating boxes indicate the MFI of IL-2 and IFN-γ. The results are representative of three independent experiments. Litt, littermate; CkbTg, Ckb transgenic mouse.
Figure 7
Figure 7. Suppression of Ckb activity attenuates TCR-mediated responses in T cells.
(A) Flow cytometric analysis of CD25 expression on CD4 and CD8 T cells, cells were stimulated with plate-bound anti-CD3 and anti-CD28 antibodies (10 µg/ml each) with or without cCr or left unstimulated for 12 h, cCr were used at 50 mM. (B) Proliferation of CFSE-labeled lymphocytes was detected as described in Figure 6B. To be note, the concentration of cCr was 25 mM and the concentration of anti-CD3 and anti-CD28 is 5 µg/ml each. (C) Analysis of cytokine production, cell were treat with or without cCr (50 mM) for 12 h, then left unstimulated or stimulated with PMA and IM for 4 h and analyzed for CD4, CD8, IL-2 and IFN-γ expression. Values in the gating boxes indicate the percentage of IL-2+ or IFN-γ+ cells and numbers underneath the gating boxes indicate the MFI of IL-2 and IFN-γ. (D) Down-regulation of Ckb expression by lentiviral-mediated RNA interference. T cells were infected with either control (Ctrl) or Ckb-specific shRNA (shRNA), cells were then sorted on the basis of GFP expression and GFP positive (effectively infected) cells were subjected to Immunoblot analysis with Ckb antibodies, the optical density of the bands was quantified and normalized against that of β-actin. (E) Flow cytometric analysis of CD25 expression on T cells. T cells were infected with either control or Ckb-specific shRNA and then stimulated with plate-bound anti-TCR and anti-CD28 antibodies (10 µg/ml each). Analyses were gated on GFP (uninfected) or GFP+ (infected) cells. The results are representative of two to three independent experiments.

References

    1. Goldrath AW, Bevan MJ. Selecting and maintaining a diverse T-cell repertoire. Nature. 1999;402:255–262. - PubMed
    1. Sebzda E, Mariathasan S, Ohteki T, Jones R, Bachmann MF, et al. Selection of the T cell repertoire. Annu Rev Immunol. 1999;17:829–874. - PubMed
    1. Hogquist KA, Baldwin TA, Jameson SC. Central tolerance: learning self-control in the thymus. Nat Rev Immunol. 2005;5:772–782. - PubMed
    1. Sprent J, Webb SR. Intrathymic and extrathymic clonal deletion of T cells. Curr Opin Immunol. 1995;7:196–205. - PubMed
    1. Starr TK, Jameson SC, Hogquist KA. Positive and negative selection of T cells. Annu Rev Immunol. 2003;21:139–176. - PubMed

Publication types

Substances