. 2009;4(4):e4841.
doi: 10.1371/journal.pone.0004841. Epub 2009 Apr 1.

Characterization of voltage-gated Ca(2+) conductances in layer 5 neocortical pyramidal neurons from rats

Affiliations

Characterization of voltage-gated Ca(2+) conductances in layer 5 neocortical pyramidal neurons from rats

Mara Almog et al. PLoS One. 2009.

Abstract

Neuronal voltage-gated Ca(2+) channels are involved in electrical signalling and in converting these signals into cytoplasmic calcium changes. One important function of voltage-gated Ca(2+) channels is generating regenerative dendritic Ca(2+) spikes. However, the Ca(2+) dependent mechanisms used to create these spikes are only partially understood. To start investigating this mechanism, we set out to kinetically and pharmacologically identify the sub-types of somatic voltage-gated Ca(2+) channels in pyramidal neurons from layer 5 of rat somatosensory cortex, using the nucleated configuration of the patch-clamp technique. The activation kinetics of the total Ba(2+) current revealed conductance activation only at medium and high voltages suggesting that T-type calcium channels were not present in the patches. Steady-state inactivation protocols in combination with pharmacology revealed the expression of R-type channels. Furthermore, pharmacological experiments identified 5 voltage-gated Ca(2+) channel sub-types - L-, N-, R- and P/Q-type. Finally, the activation of the Ca(2+) conductances was examined using physiologically derived voltage-clamp protocols including a calcium spike protocol and a mock back-propagating action potential (mBPAP) protocol. These experiments enable us to suggest the possible contribution of the five Ca(2+) channel sub-types to Ca(2+) current flow during activation under physiological conditions.


Conflict of interest statement

Competing Interests: The authors have declared that no competing interests exist.

Figures

Figure 1
Figure 1. Ca2+ and Ba2+ currents recordings from nucleated patches.
a, Currents recorded from a nucleated patch with a Cs-gluconate pipette solution and a Ca2+ (2 mM) application solution. A 500 ms pre-pulse to −110 mV was followed by a 100 ms pulse to voltages between −80 and +40 mV at 10 mV increments. The −110 mV pre-pulse was truncated to facilitate the display of the current. Records were sampled at 20 KHz and filtered at 5 KHz. Leak was subtracted on-line. The voltage protocol is shown below the current traces. b, Inward and outward currents from a nucleated patch using a K-gluconate pipette solution and a Ca2+ (2 mM) application solution (see methods). The overlapping traces are marked in red in order to highlight them. The voltage protocol and scale bar as in a. The voltage protocol is shown below the current traces. c, Inward currents from a nucleated patch using a K-gluconate pipette solution and a Ba2+ (5 mM) application solution (see methods). The overlapping traces are marked in red in order to highlight them. The voltage protocol and scale bar as in a. The voltage protocol is shown below the current traces. d, Mean activation curves of the Ca2+ current in b (•, n = 6) and the Ba2+ current in c (○, n = 5). The currents were normalized to the maximal conductance at a given series of voltages. The smooth lines are the fit to a Boltzmann function with one gate with a V1/2 of 0±1 mV, k = 7.2±0.2 mV, ECa = 47±1 mV for the Ca2+ currents (•) and a V1/2 of −7±1 mV, k = 7.3±0.2 mV, EBa = 62±1 mV for the Ba2+ currents (○). Error bars are S.E.M.
Figure 2
Figure 2. Runup and rundown of Ba2+ currents.
a, The normalized current of one nucleated patch as a function of time. t = 0 indicates the rupture of the membrane separating the pipette solution from the cell and its positioning in front of the Ba2+ application solution. The pipette solution contained 0.5 mM EGTA. The currents were recorded using a ramp protocol from −100 mV to +80 mV for 50 ms with a time interval between the protocols of 5 seconds. Records were sampled at 10 KHz and filtered at 2 KHz. Leak was subtracted on-line. b, Activation curves of Ba2+ currents obtained at t = 0 (control), t = 47 s (runup) and t = 273 s (rundown) in the experiment shown in a. The smooth lines are the fit to a Boltzmann function with one gate to the current obtained at time 0 (control), after 47 seconds (runup) and after 270 seconds (rundown). This fit gave a mean Gmax of 2.7±0.3 nS, V1/2 of 3±1 mV, k = 7.5±0.6 mV, EBa = 43±2 mV for the control current (n = 15), a mean Gmax of 3.2±0.3 nS, V1/2 of −2±1 mV, k = 7.7±0.3 mV, EBa  = 46±2 mV for the runup current (n = 17) and a mean Gmax of 2.3±0.2 nS, V1/2 of −2±3 mV, k = 7.6±0.5 mV, EBa = 44±2 mV for the rundown current (n = 16).
Figure 3
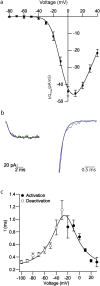
Figure 3. Activation and deactivation of Ba2+ currents in nucleated patches.
a, Activation curve of the Ba2+ current. The mean currents were normalized to the maximal conductance for a given series of voltages (n = 5). The smooth line is the fit to a Boltzmann function with two gates with a V1/2 of −14.2±0.6 mV, k = 9.8±0.6 mV, EBa = 59±2 mV. Error bars are S.E.M. b, Activation (left) and deactivation (right) fitting of a second order Hodgkin-Huxley model (thick line). c, Activation (•, n = 10) and deactivation (○, n = 8) time constants determined from traces like those in b. The smooth line is the curve fit to the equation: C1+C2/((V-C3)2+C4), where C1 is the time constant at 0 voltage, C2 is the height of the equation peak, C3 is the voltage at the center of the peak and C4 is the standard deviation. The fit gave a C1 = 0.20±0.08 ms, C2 = 0.6±0.2 ms*mV2, C3 = −25.7±1.7 mV and C4 = 0.7±0.2 mV2. Errors bars are S.E.M.
Figure 4
Figure 4. Inactivation kinetics of Ba2+ currents in nucleated patches.
a, Inactivation of inward currents recorded from a nucleated patch using Ba2+ application solution. Inward current was generated by a 150 ms pulse to voltages between −90 and 0 mV with 10 mV increments. The patch was subjected to a 50 ms depolarising step to 0 mV (the voltage protocol is shown below the traces). The voltage was stepped to −80 mV for 50 ms after every sweep to allow Ca2+ channels to recover from inactivation (not shown). Records were sampled at 50 KHz and filtered at 2 KHz. Leak was subtracted on-line. b, Mean inactivation curve of the control current (•, n = 7) and the current remained after application of the blocker SNX-482 (○, n = 4). The peak current was normalized to the maximal current obtained from a series of pulses in the control conditions. The smooth line is the line calculated using a combination of two Boltzmann functions with one gate. The fit gave a first V1/2 of −79±3 mV and a second V1/2 of −23±2 mV, a k1 = −8±3 mV and a k2 = −7±1 mV. The dash lines are the separated Boltzman functions fitted to the control current. Errors bars are S.E.M. c, Mean inactivation time constant calculated from the rising phase of the activation currents which were recorded using Ca2+ application solution (n≥8). The smooth line was calculated using a fit of the equation C1+C2*exp(-((V-C3)/C4)2), where C1 is the time constant at 0 voltage, C2 is the height of the Gaussian peak, C3 is the voltage at the center of the peak and C4 is the standard deviation. This fit gave a C1 = 50 ms, C2 = 22.10 ms, C3 = 20 mV and C4 = 12 mV. Errors bars are S.E.M.
Figure 5
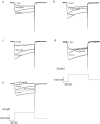
Figure 5. Pharmacological separation of the 5 Ba2+ current sub-types with Ca2+ channel blockers.
a, Currents evoked by a 50 ms step depolarization to 0 mV from a holding potential of −110 mV before (control) and after application of 10 µM nifedipine. The nifedipine-sensitive current (L-type) was obtained by subtraction. b,c,d and e, Same stimulation protocol as in a. b, 1 µM ω-CgTx GVIA (N-type blocker) was added to the application solution. c, 30 nM SNX-482 (R-type blocker) was added to the application solution. d, 200 nM ω-AgTx IVA (P-type blocker) was added to the application solution. e, the control current was recorded with an application solution containing blockers for L-, N-, R- and P-type. In order to eliminate the remaining current 1 µM ω-CgTx MVIIC (Q-type blocker) was added to the application solution.
Figure 6
Figure 6. Ba2+ currents recorded using different physiological pulses.
a, A mBPAP generated using parameters of somatic AP was used as a voltage-clamp command in the nucleated patch (bottom, the rise phase of the action potential was simulated by a 0.6 ms ramp from a holding potential of −60 mV to +40 mV and the repolarization phase of an action potential is simulated by a 2 ms ramp from +40 mV to the holding voltage potentia). This evoked a Ba2+ current. Shown are the current evoked by the mBPAP before (control) and after 1 µM ω-CgTx GVIA (N-type blocker). The ω-CgTx GVIA-sensitive current (N-type) was obtained by subtraction. b, A mBPAP generated to simulate a back-propagating AP at the dendrite about 170 µm from the soma was used as a voltage-clamp command in the same nucleated patch as in a (bottom similar ramps to that described in A were used to simulate a back-propagating AP. In order to simulate the amplitude decay and the half with increase of a back-propagating AP, the maximal ramp amplitude was reduced by 6 mV in each step and the time of the rising and decline ramps was increased by 0.1 ms and 0.8 ms in each step, respectively). As in a, this evoked a Ba2+ current shown here before (control) and after 1 µM ω-CgTx GVIA (N-type blocker). The ω-CgTx GVIA-sensitive current (N-type) was obtained by subtraction. c, The net average charge (Q) displayed as a percentage of the first mBPAP (control) (•, n = 14). A back-propagating action potential measured at 200 µm in these cells was used as a voltage-clamp command applied to the patched and is displayed as a percentage of the action potential generated at the soma (○, n = 4). The data is plotted as a function of the equivalent distance of mBPAP from the soma in µm. Error bars are S.E.M. The asterisk indicates a significant difference (p<0.005, one-tail t-test) between the mAP at the soma from the different mBPAPs along the dendrite. d, A Ca2+ spike as recorded at the distal dendrite (550 µm from the soma) of a L5 pyramidal neuron was used as a voltage-clamp command in the same nucleated patch as in a, (bottom). The Ca2+ spike was 140 ms long. This evoked a Ba2+ current, shown here before (control) and after 1 µM ω-CgTx GVIA (N-type blocker). The ω-CgTx GVIA-sensitive current (N-type, grey) was obtained by subtraction.
Figure 7
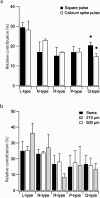
Figure 7. The contribution of Ba2+ current sub-types for different pulses to nucleated patch currents in neocortical L5 pyramidal neurons.
a, The net average charge (Q) for each channel sub-type evoked by a square pulse (black bars) and a Ca2+ spike pulse (white bars) is displayed in the histogram as a percentage of the control Ba2+ current. The sum of the contribution of all the channel sub-types is higher than 100%, possibly due to the rundown observed or because the blockers for each channel sub-type blocked other sub-types as well. Thus, the contribution of each channel sub-type to the total current in the different protocols was plotted as the percentage of the sum of the 5 channel sub-type currents which was normalised to 100%. The square pulse gave a channel distribution of 29.5±2.4%, n = 7 for L-type; 17±5%, n = 3 for N-type; 16.2±4.3%, n = 4 for R-type; 17±3%, n = 3 for P-type; 20.4±1.5%, n = 4 for Q-type. The Ca2+ spike pulse gave a channel distribution of 28.2±4.4%, n = 6 for L-type; 22.9±0.7%, n = 2 for N-type; 17±0.1%, n = 3 for R-type; 17.1±1.6%, n = 2 for P-type; 14.7±1.6%, n = 2 for Q-type. Error bars are S.E.M. The asterisk indicates a significant difference (p<0.05, one-tail t-test) between the two different pulses. b, The contribution (percent) of each channel sub-type to the current evoked by a mBPAP protocol (calculated as in a). The percent contribution are displayed for 3 different mBPAP, simulating a somatic action potential (black bars), a back-propagating AP at 210 µm (white bars) and a back-propagating AP at 500 µm from the soma (grey bars). Error bars are S.E.M.

References

    1. Creutzfeldt OD. Generality of the functional structure of the neocortex. Naturwissenschaften. 1977;64:507–517. - PubMed
    1. Lai HC, Jan LY. The distribution and targeting of neuronal voltage-gated ion channels. Nat Rev Neurosci. 2006;7:548–562. - PubMed
    1. Spruston N. Pyramidal neurons: dendritic structure and synaptic integration. Nat Rev Neurosci. 2008;9:206–221. - PubMed
    1. Reuter H. Calcium channel modulation by neurotransmitters, enzymes and drugs. Nature. 1983;301:569–574. - PubMed
    1. Larkum ME, Watanabe S, Nakamura T, Lasser-Ross N, Ross WN. Synaptically activated Ca2+ waves in layer 2/3 and layer 5 rat neocortical pyramidal neurons. J Physiol. 2003;549:471–488. - PMC - PubMed

Publication types