Impact of surface electric properties of carbon-based thin films on platelets activation for nano-medical and nano-sensing applications
- PMID: 19337414
- PMCID: PMC2636585
- DOI: 10.2147/ijn.s3607
Impact of surface electric properties of carbon-based thin films on platelets activation for nano-medical and nano-sensing applications
Abstract
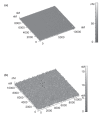
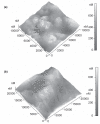
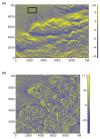
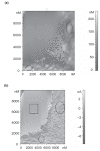
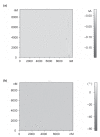
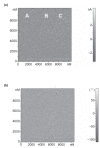
Electric surface properties of biomaterials, playing key role to various biointerfacial interactions, were related to hemocompatibility and biosensing phenomena. In this study, the examination of surface electric properties of amorphous hydrogenated carbon thin films (a-C:H) was carried out by means of electrostatic force microscope (EFM) and observation of differences in spatial charge distribution on the surface of the examined films during platelets adhesion was made. The thrombogenic potential of a-C:H thin films developed by magnetron sputtering with approximately 42% sp(3) content and hydrogen partial pressure during deposition was evaluated, by in situ observation with atomic force microscope (AFM) of platelets' activation and their subsequent adhesion. Platelet-rich plasma drawn from healthy donors was used and semi-contact mode of AFM was applied. Platelets behavior and their correlation with the electric surface properties of the examined a-C:H films by EFM was made for hemocompatibility enhancement and sensing platelets that are less electrical negatively charged and with higher tendency to aggregate and form thrombus. The results are discussed in view of the effect of different deposition conditions of hydrogenated carbon films on their structural and morphological characteristics, surface roughness and electrical properties attributing to different hemocompatibility and sensing aspects.
Keywords: amorphous hydrogenated carbon; atomic force microscopy; electric force microscopy; medical applications; platelets; thrombogenicity.
Figures



References
-
- Bosmann HB. Platelet adhesiveness and aggregation: II. Surface sialic acid, glycoprotein:N-acetylneuraminic acid transferase, and neuraminidase of human blood platelets. Biochim Biophys Acta. 1972;279:456–74. - PubMed
-
- Charitidis C, Logothetidis S, Gioti M, et al. A comparative study of the nanoscratching behavior of amorphous carbon films grown under various deposition conditions. Surf Coat Technol. 2000;125:201–6.
-
- Cui F, Li D. A review of investigations on biocompatibility of diamond-like carbon and carbon nitride films. Surf Coat Technol. 2000;131:481–7.
-
- Hai-Tong S, Zheng-Hao L, Zhou J, et al. An electrostatic force microscope study of Si nanostructures on Si(1 0 0) as a function of post-annealing temperature and time. Appl Surf Sci. 2007;253:6109–12.
MeSH terms
Substances
LinkOut - more resources
Full Text Sources
Miscellaneous

