

Apparent half-lives of dioxins, furans, and polychlorinated biphenyls as a function of age, body fat, smoking status, and breast-feeding
- PMID: 19337517
- PMCID: PMC2661912
- DOI: 10.1289/ehp.11781
Apparent half-lives of dioxins, furans, and polychlorinated biphenyls as a function of age, body fat, smoking status, and breast-feeding
Abstract
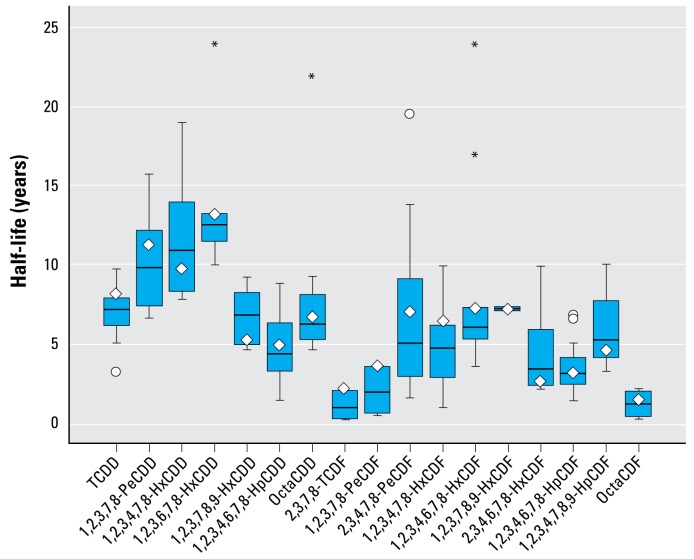
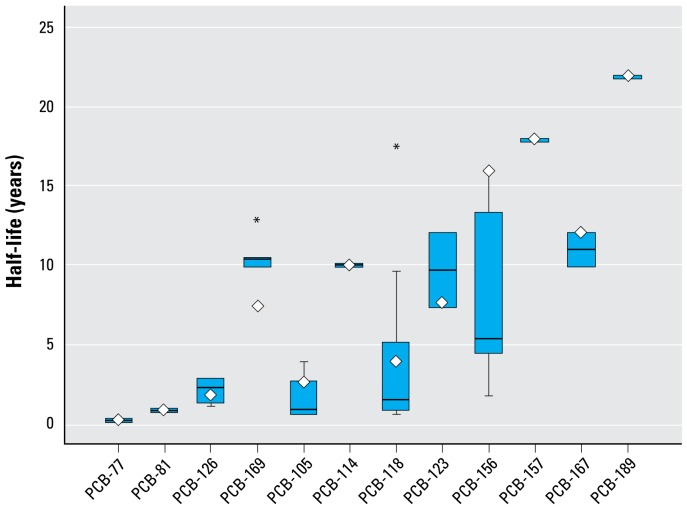
Objective: In this study we reviewed the half-life data in the literature for the 29 dioxin, furan, and polychlorinated biphenyl congeners named in the World Health Organization toxic equivalency factor scheme, with the aim of providing a reference value for the half-life of each congener in the human body and a method of half-life estimation that accounts for an individual's personal characteristics.
Data sources and extraction: We compared data from >30 studies containing congener-specific elimination rates. Half-life data were extracted and compiled into a summary table. We then created a subset of these data based on defined exclusionary criteria.
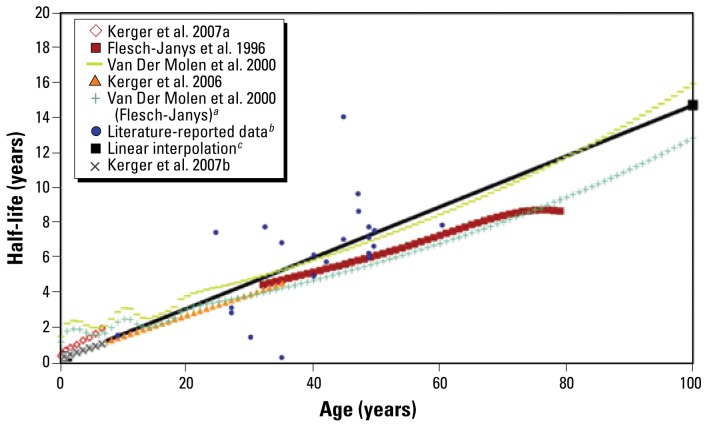
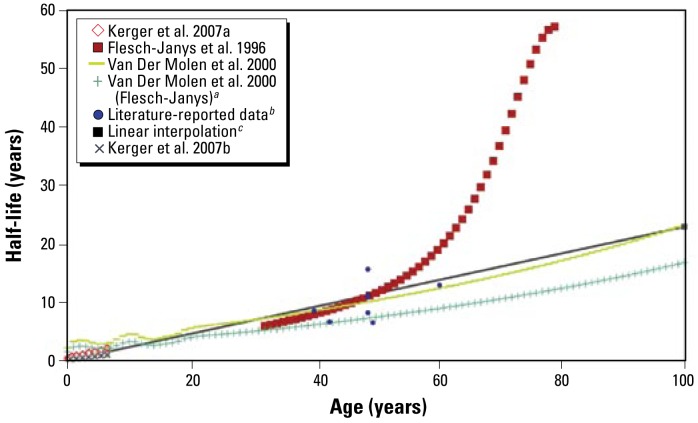
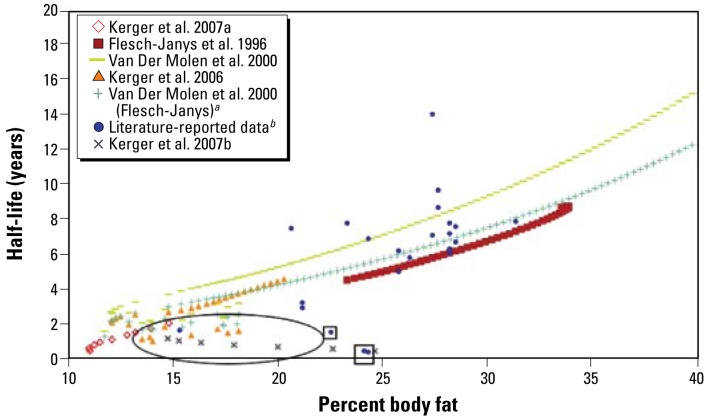
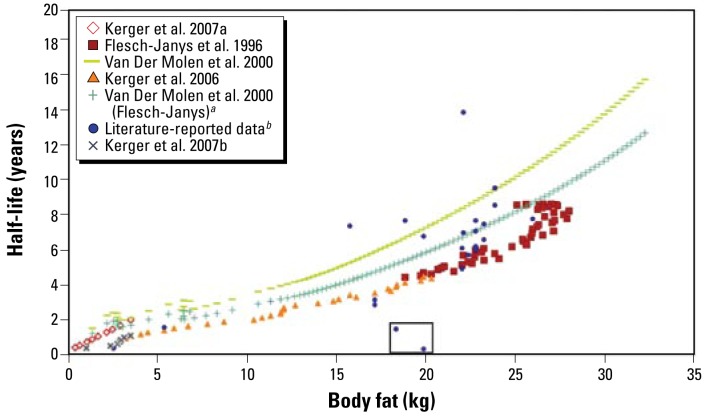
Data synthesis: We defined values for each congener that approximate the half-life in an infant and in an adult. A linear interpolation of these values was used to examine the relationship between half-life and age, percent body fat, and absolute body fat. We developed predictive equations based on these relationships and adjustments for individual characteristics.
Conclusions: The half-life of dioxins in the body can be predicted using a linear relationship with age adjusted for body fat, smoking, and breast-feeding. Data suggest an alternative method based on a linear relationship between half-life and total body fat, but this approach requires further testing and validation with individual measurements.
Keywords: elimination rate; half-life; pharmacokinetics; poly-chlorinated dibenzofurans; polychlorinated biphenyls; polychlorinated dibenzo-p-dioxins.
Figures
References
-
- Abraham K, Geusau A, Tosun Y, Helge H, Bauer S, Brockmoller J. Severe 2,3,7,8-tetrachlorodibenzo-p-dioxin (TCDD) intoxication: insights into the measurement of hepatic cytochrome P450 1A2 induction. Clin Pharmacol Ther. 2002;72(2):163–174. - PubMed
-
- Abraham K, Knoll A, Ende M, Päpke O, Helge H. Intake, fecal excretion, and body burden of polychlorinated dibenzo-p-dioxins and dibenzofurans in breast-fed and formula-fed infants. Pediatr Res. 1996;40(5):671–679. - PubMed
-
- Abraham K, Päpke O, Gross A, Kordonouri O, Wiegand S, Wahn U, et al. Time course of PCDD/PCDF/PCB concentrations in breast-feeding mothers and their infants. Chemosphere. 1998;37(9–12):1731–1741. - PubMed
-
- Aylward LL, Brunet RC, Carrier G, Hays SM, Cushing CA, Needham LL, et al. Concentration-dependent TCDD elimination kinetics in humans: toxicokinetic modeling for moderately to highly exposed adults from Seveso, Italy, and Vienna, Austria, and impact on dose estimates for the NIOSH cohort. J Expo Anal Environ Epidemiol. 2005;15(1):51–65. - PubMed
-
- Brown JF, Lawton RW. Factors controlling the distribution and levels of PCBs after occupational exposure. In: Robertson LW, Hansen LG, editors. PCBs: Recent Advances in Environmental Toxicology and Health Effects. Lexington, KY: University Press of Kentucky; 2001. pp. 103–110.
Publication types
MeSH terms
Substances
LinkOut - more resources
Full Text Sources