. 2009 Apr 28;3(4):995-1003.
doi: 10.1021/nn9000897.

Electronic control of DNA polymerase binding and unbinding to single DNA molecules

Affiliations

Electronic control of DNA polymerase binding and unbinding to single DNA molecules

Noah A Wilson et al. ACS Nano. .

Abstract

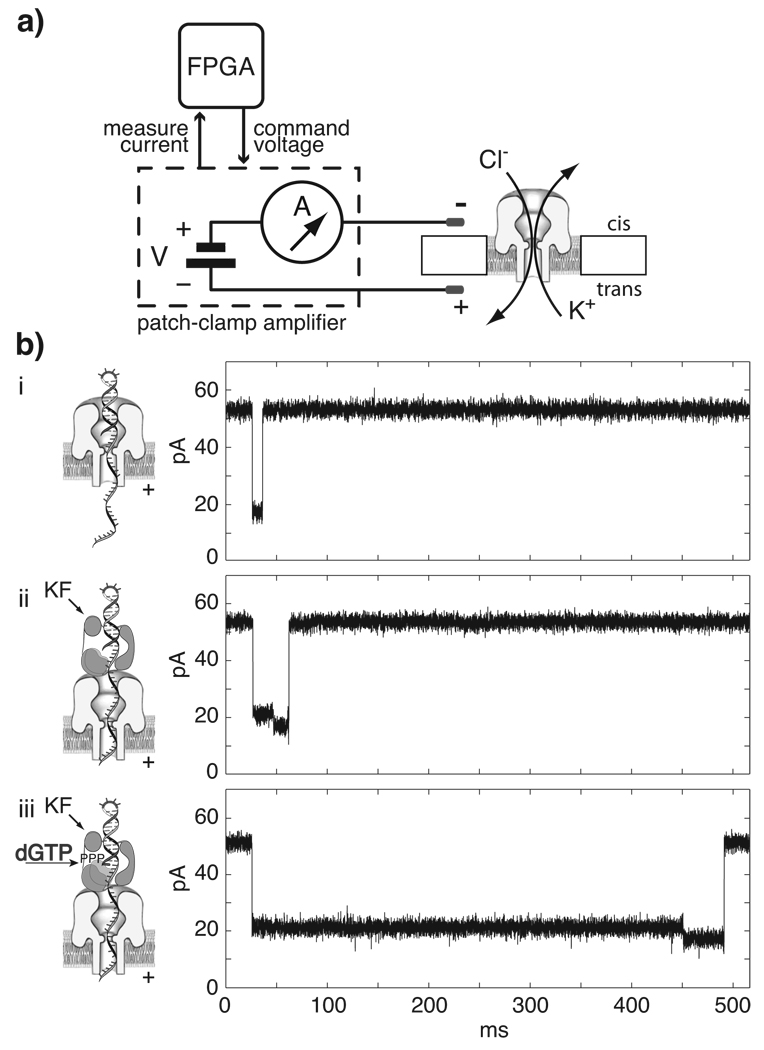
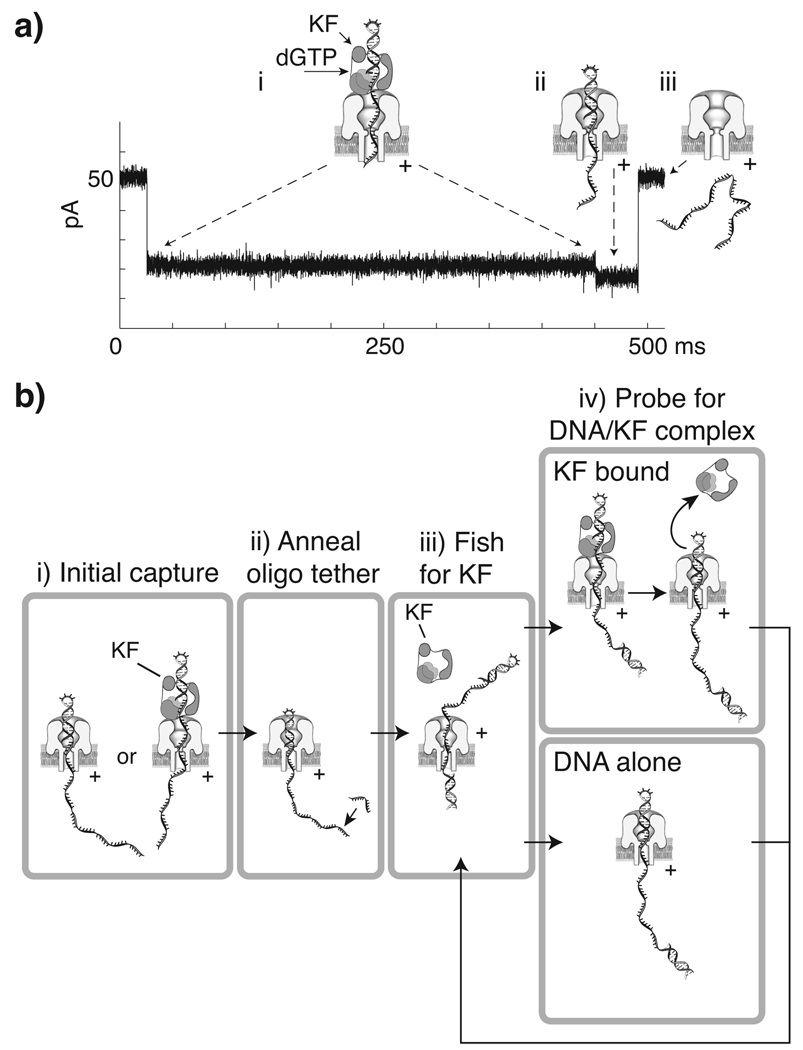
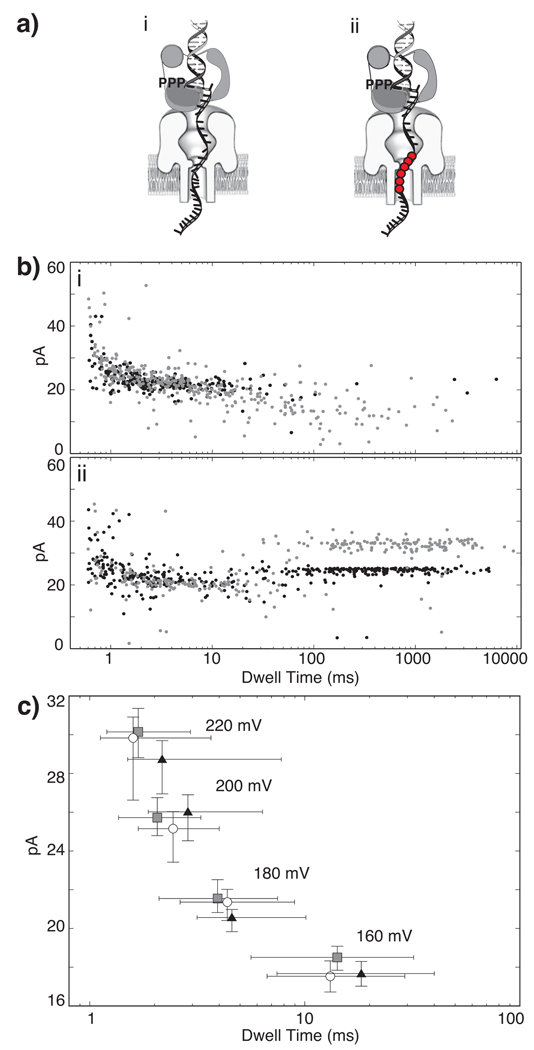
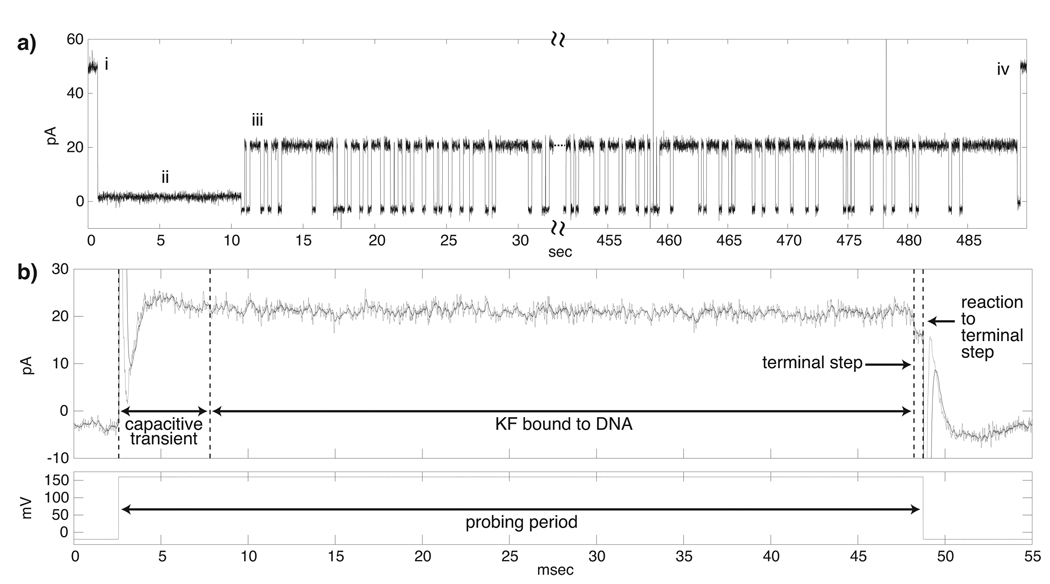
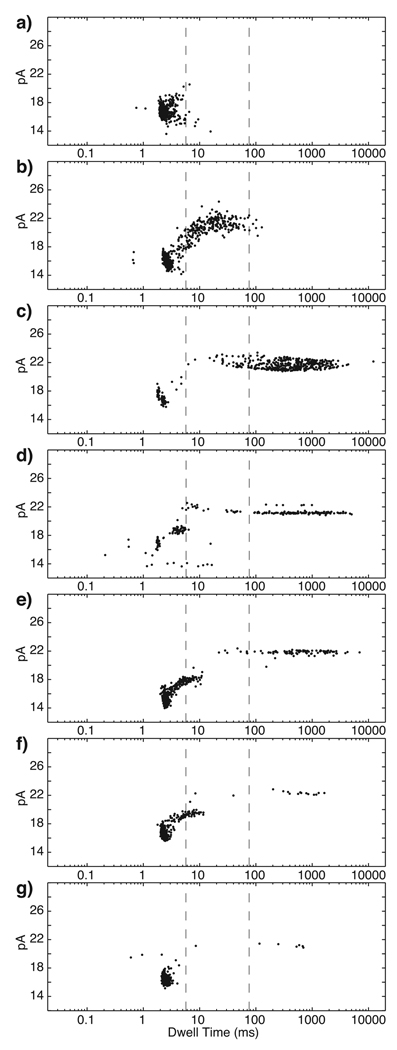
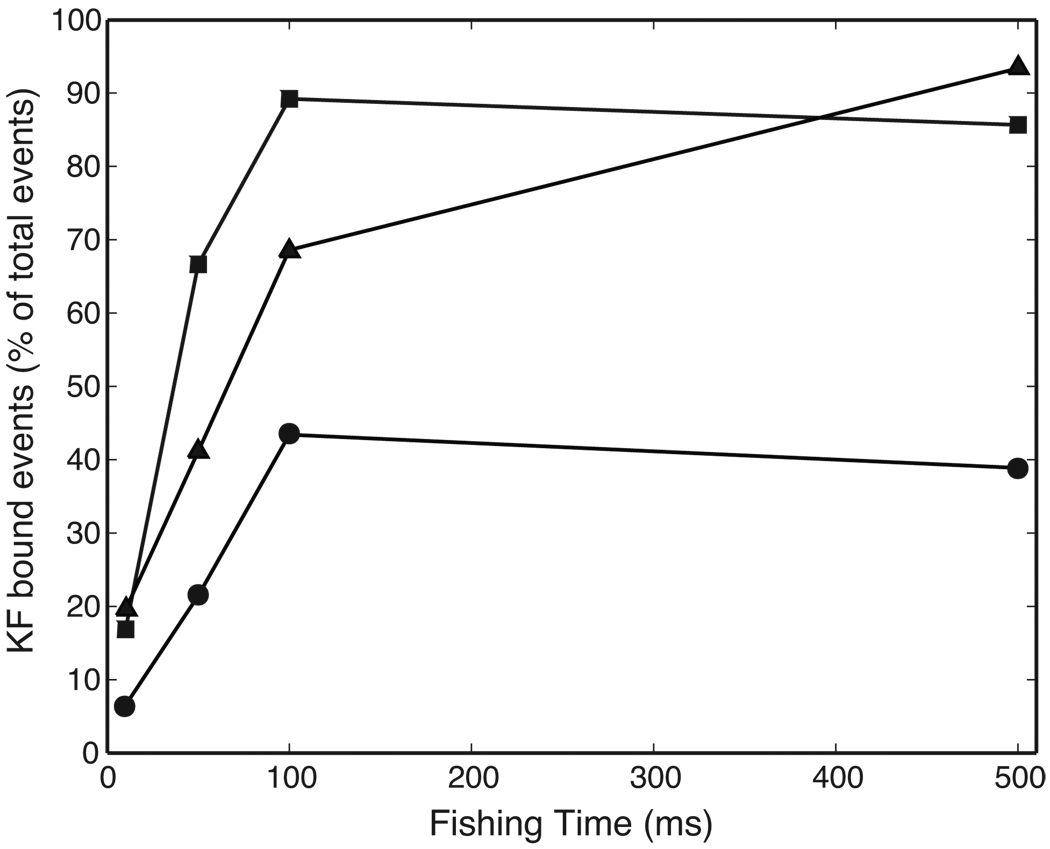
DNA polymerases catalyze template-dependent genome replication. The assembly of a high affinity ternary complex between these enzymes, the double strand-single strand junction of their DNA substrate, and the deoxynucleoside triphosphate (dNTP) complementary to the first template base in the polymerase active site is essential to this process. We present a single molecule method for iterative measurements of DNA-polymerase complex assembly with high temporal resolution, using active voltage control of individual DNA substrate molecules tethered noncovalently in an alpha-hemolysin nanopore. DNA binding states of the Klenow fragment of Escherichia coli DNA polymerase I (KF) were diagnosed based upon their ionic current signature, and reacted to with submillisecond precision to execute voltage changes that controlled exposure of the DNA substrate to KF and dNTP. Precise control of exposure times allowed measurements of DNA-KF complex assembly on a time scale that superimposed with the rate of KF binding. Hundreds of measurements were made with a single tethered DNA molecule within seconds, and dozens of molecules can be tethered within a single experiment. This approach allows statistically robust analysis of the assembly of complexes between DNA and RNA processing enzymes and their substrates at the single molecule level.


Figures

Figure 1
Figure 1. KF binding to individual DNA molecules captured in a nanopore
a) Schematic of the nanopore device. A patch-clamp amplifier supplies voltage and measures ionic current through a single α-hemolysin channel inserted in a ~25 µm diameter lipid bilayer. Field programmable gate array (FPGA) hardware connected to the amplifier monitors current levels with high temporal resolution (~200 kHz) and allows rapid execution of voltage control logic. b) Illustrations and representative current traces for nanopore capture events of (i) unbound DNA hairpin, (ii) DNA-KF binary complex, and (iii) DNA-KF-dNTP ternary complex.
Figure 2
Figure 2. Use of the two step current signature of DNA-KF and DNA-KF-dNTP complexes to control KF association and dissociation from a DNA substrate tethered in the nanopore
a) Representative current trace and illustration of corresponding molecular events during nanopore capture of a DNA-KF-dGTP ternary complex. The initial ~21.5 pA blockade (i) arises from capture of the enzyme bound DNA, with the duplex held atop the pore vestibule bound to KF. The shorter ~18.5 pA terminal step (ii) occurs upon KF dissociation, when duplex DNA is pulled into the nanopore vestibule, followed by (iii) duplex unzipping and translocation of the DNA through the nanopore, and return to the open channel current. b) Strategy for control of iterative KF association and dissociation from a nanopore-tethered DNA molecule. (i) A DNA hairpin, either KF bound or unbound, is captured under applied voltage. When the amplitude level that distinguishes capture of DNA alone or the terminal step of KF bound events is detected, (ii) the FSM lowers the voltage to hold the hairpin duplex in the pore vestibule long enough to anneal an oligonucleotide to the single-stranded end protruding into the trans chamber. With the DNA tethered in the pore by duplexes at both ends, a negative voltage is applied (iii) to expose the DNA to KF in the cis chamber (‘fishing’). After a programmed time period, the voltage is reversed (iv) to draw the duplex back to the pore and diagnose whether it is KF bound based upon amplitude (‘probing’). Detection of unbound DNA prompts a return to the fishing voltage. Diagnosis of the KF bound state results in continued application of the probing voltage until the terminal step is detected, which then prompts a return to fishing.
Figure 3
Figure 3. Characterization of molecular events that cause the two step current signature of DNA-KF complexes in the nanopore
a) Diagram of nanopore capture of a DNA-KF-dGTP ternary complex with (i) the all DNA template, and (ii) the 6 abasic residue-containing template. Abasic residues are in template positions +12 to +17, and are shown as red circles. b) Superimposed plots showing amplitude vs. dwell time for capture events for DNA substrates with abasic-containing template (black dots) or the all DNA template (grey dots). In (i) 1 µM DNA is present but KF and dGTP are absent; in (ii) 1 µM DNA, 1 µM KF and 200 µM dGTP are present. Offline data analysis described in Methods was used to extract the EBS and terminal steps from each event in b(ii). This experiment was conducted at 180 mV applied voltage. c) Median amplitude vs. median dwell time plot for DNA alone (grey squares), or the terminal current steps of binary (white circles) or ternary complexes (black triangles) captured from the bulk phase in the cis chamber at the indicated constant voltage levels (error bars are defined by first and third quartiles). Each data point was obtained from analysis of 181 to 552 events.
Figure 4
Figure 4. Fishing for KF with DNA tethered in the nanopore
a) Representative current trace for (i) DNA capture, (ii) DNA tethering via annealing of trans side oligonucleotide, (iii) ~500 cycles of fishing and probing and (iv) DNA translocation and return to open channel current. In this experiment the fishing interval was 250 ms, with 1 µM DNA, 2 µM KF, and 400 µM dGTP in the cis chamber. b) Expanded current trace and corresponding applied voltage levels (below) during a single fishing and probing cycle. The trace shows the ~5 ms capacitive transient that follows the change from the −20 mV fishing voltage to the 160 mV probing voltage. The filtered signal (black trace) mitigates noise present in the raw signal (grey trace) to avoid false detection of terminal steps. This event was diagnosed as enzyme bound since its amplitude was outside [14.75, 18.75] pA, the range employed to diagnose DNA alone events and terminal steps. The 160 mV probing voltage was maintained until detection of the current drop to within [14.75, 18.75] pA, followed by an additional 0.5 ms to ensure accurate diagnosis. A voltage reversal to −20mV to fish again is then applied.
Figure 5
Figure 5. Control of complex assembly by varying fishing duration
Plots of amplitude vs. dwell time for events detected in the probing step after a 500 ms fishing interval with a) DNA alone (1 µM), b) DNA and KF (2 µM), or c) DNA, KF and dGTP (400 µM) present in the bulk phase in the nanopore cis chamber. With DNA, KF, and dGTP present, the fishing time interval was reduced to d) 50 ms, e) 10 ms, f) 7.5 ms, or g) 5 ms. The two dashed vertical lines through the plots indicate the upper dwell time limits for DNA alone (5.61 ms) and KF-DNA binary complexes (75.22 ms), determined as described in Table 1. The upper dwell time limit for DNA alone is shorter than the median dwell time for DNA alone (14.7 ms) in Figure 3c because in fishing experiments these events are truncated by a voltage reversal (Figure 2b).
Figure 6
Figure 6. Effect of dGTP on DNA-KF complex assembly
Plot of the percentage of total events diagnosed as KF-bound when the fishing interval was varied in the presence of 1 µM DNA, 2 µM KF, either absent dGTP (circles), or in the presence of 50 µM dGTP (triangles), or 400 µM dGTP (squares). The percentage of EBS events was determined as described in Methods. Percentage values for each plotted point were determined from at least 255 and up to 7828 events (Table 2).

Comment in

References

    1. Joyce CM, Steitz TA. Function and Structure Relationships in DNA Polymerases. Anal. Rev. Biochem. 1994;63:777–822. - PubMed
    1. Joyce CM, Benkovic SJ. DNA Polymerase Fidelity: Kinetics, Structure, and Checkpoints. Biochemistry. 2004;43:14317–14324. - PubMed
    1. Brautigam CA, Steitz TA. Structural and Functional Insights Provided by Crystal Structures of DNA Polymerases and their Substrate Complexes. Current Opinion in Structural Biology. 1998;8:54–63. - PubMed
    1. Joyce CM, Potapova O, Delucia A, Huang X, Basu V, Grindley NDF. Fingers-Closing and Other Rapid Conformational Changes in DNA Polymerase I (Klenow Fragment) and Their Role in Nucleotide Selectivity. Biochemistry. 2008;47:6103–6116. - PubMed
    1. Doublié S, Tabor S, Long AM, Richardson CC, Ellenberger T. Crystal Structure of a Bacteriophage T7 DNA Replication Complex at 2.2 Å Resolution. Nature. 1998;391:251–258. - PubMed

Publication types