Review
. 2009 May;27(5):266-76.
doi: 10.1016/j.tibtech.2009.02.006. Epub 2009 Mar 30.

Live-imaging fluorescent proteins in mouse embryos: multi-dimensional, multi-spectral perspectives

Affiliations
Review

Live-imaging fluorescent proteins in mouse embryos: multi-dimensional, multi-spectral perspectives

Sonja Nowotschin et al. Trends Biotechnol. 2009 May.

Abstract

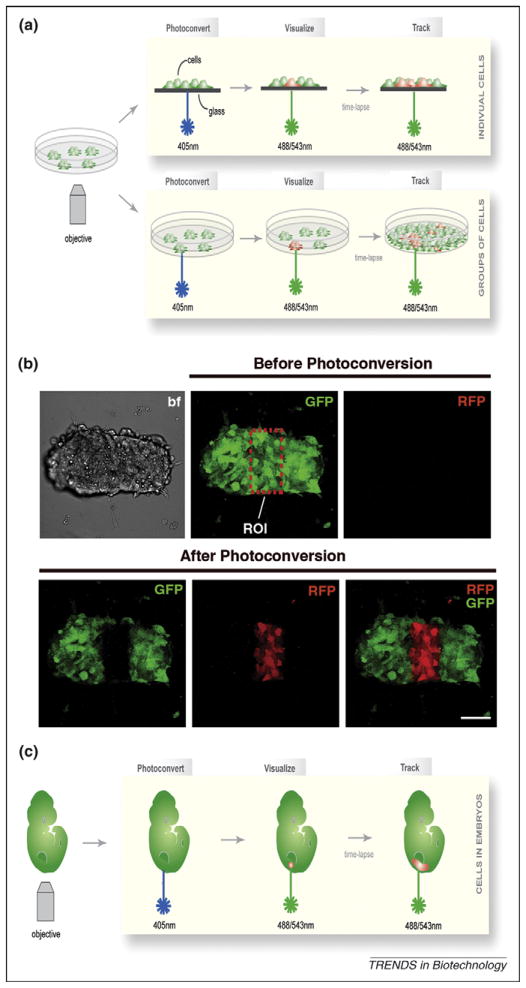
Microscopy has always been an obligate tool in the field of developmental biology, a goal of which is to elucidate the essential cellular and molecular interactions that coordinate the specification of different cell types and the establishment of body plans. The 2008 Nobel Prize in chemistry was awarded 'for the discovery and development of the green fluorescent protein, GFP' in recognition that the discovery of genetically encoded fluorescent proteins (FPs) has spearheaded a revolution in applications for imaging of live cells. With the development of more-sophisticated imaging technology and availability of FPs with different spectral characteristics, dynamic processes can now be live-imaged at high resolution in situ in embryos. Here, we review some recent advances in this rapidly evolving field as applied to live-imaging capabilities in the mouse, the most genetically tractable mammalian model organism for embryologists.


Figures

Figure 1
Figure 1
Histone fusions localize fluorescent proteins (FPs) to chromatin and make them ideal for cell tracking. (a) Arrangement for imaging FPs expressed in the mouse embryo. 2D raw data (2D x-y images taken at different z stacks) of cells of interest in the embryo is rendered into 3D data using software packages. Images on the right depict 3D rendered images of GFP-expressing cells. The top panel is the green channel overlayed on a bright field image illustrating the contour of the ES cell colony, and the bottom panel shows the green channel only. (bf) Cell tracking using fluorescent fusion proteins. Nuclear localization sequences (NLSs) are commonly used for the nuclear localization of gene-based reporters; however, when a cell divides (the round cell in the schematic drawing is destined to divide by mitosis) and the nuclear envelope breaks down, the reporter protein becomes distributed throughout the cell, causing a reduction in the fluorescence intensity. (b) No individual cells can be identified with cytoplasmically expressed GFP. Cells cannot be tracked. (c) Individual cells can be identified (schematized in different colors), counted and tracked using GFP fusion to NLS sequences (nlsGFP), especially when used in combination with software applications that can perform particle tracking functions. Because nuclei are single entities, they are ideal for assigning computational ‘particle’ status. Such a ‘particle’ can be tagged and followed computationally through a time-lapse series so that a set of tracks can be generated, with each track representing positional information (over time) for any given cell. However, computational methods designed to track cells usually lose track of an NLS-reporter-expressing cell that has divided, because it essentially disappears. This is a common problem, and such computational methods usually cannot distinguish between cells that divide and cells that die because, in both cases, the tracks terminate within the experimental time frame. (d) Histone fusions (H2B–GFP) remain bound to chromatin during cell division. Therefore, the computer can keep track of the cells expressing an H2B–GFP fusion reporter during cell division. In addition, they also provide information on the plane of cell division and the designation of daughter cells. (e,f) Each panel represents a time-point from a rendered z-stack of an x-y-z-t (4D) experiment imaging cell dynamics in cell populations expressing an H2B–GFP fusion reporter. Expression of an H2B-GFP fusion reporter and 3D time-lapse imaging provides information of single cell position and orientation of cell divisions within a population of cells. (e) Bright field of a time-lapse sequence of an ES cell colony. (f) Green channel of a time-lapse sequence of a gastrulating mouse embryo.
Figure 2
Figure 2
Dual-tagged ES cells with H2B–GFP as a nuclear marker and myr–RFP as a label for the plasma membrane. ES cells expressing H2B–GFP and myr–RFP provide information about cell divisions (each phase of mitosis can be distinguished), apoptosis (nuclear fragmentation can be visualized) and cell morphology (cell protrusions and projections, membrane fragmentation), as well as the formation and breakdown of the Golgi apparatus. Scale bar represents 20 μm.
Figure 3
Figure 3
Chimeric blastocysts containing cells expressing H2B–Cherry as a nuclear marker and GPI–GFP as a label for the plasma membrane. (ad) 2D images of chimeric mouse blastocyst. (a) Green channel showing cells of blastocysts expressing GPI–GFP labeling the plasma membrane. (b) Red channel showing expression of H2B–Cherry in the nuclei of cells. (c) Merge of green and red channel. (d) Bright field. (eh) 3D-rendered images of chimeric mouse blastocyst. (e) Green channel. (f) Red channel. (g) Merge of green and red channel. (h) Merge of bright field, green and red channel. Scale bar represents 20 μm.
Figure 4
Figure 4
Binary color coding for distinguishing different cell populations. (a) Schematic representation of using a binary color code to distinguish different cell populations. Using only two colors, it is possible to distinguish up to eight different cell populations. (b) 2D (top row) and 3D (bottom row) representations of green, red (top and bottom row) and bright-field (top row) channels and a merge of bright field, green and red channels (bottom row). The panels show an ES cell colony expressing a plasma membrane GFP (GPI–GFP) and plasma membrane RFP (myr–RFP) and nuclear GFP (H2B-GFP) and nuclear RFP (H2B-Cherry), respectively. White arrowheads: 1, GPI–GFP; 2, H2B–GFP; 3, H2B–Cherry; 4, myr–RFP. Scale bar represents 20 μm.
Figure 5
Figure 5
Photoconversion of ES cells expressing the photomodulatable fluorescent protein KikGR. (a) Schematic representation of the photoconversion of a single cell or a group of cells constitutively expressing KikGR. Before photoconversion, all cells fluoresce green. After exposure to short-wavelength light (405 nm), single cells or a group of cells in the chosen region of interest (ROI) are efficiently photoconverted and emit red fluorescence. (b) 3D images of the photoconversion of a group of cells in an ES cell colony (ROI). Images show the green and red channel before photoconversion (all cells fluoresce green, no red fluorescence is detectable), as well as green, red and a merge of both channels after photoconversion, showing efficient photoconversion of cells in the ROI. (c) Schematic representation of photoconversion in a mouse embryo constitutively expressing KikGR. Photoconverted cells can be tracked over time. A similar approach was used to demonstrate that the specification of the embryonic–abembryonic axis in the mouse is independent of the early cell lineage [66]. Scale bar represents 50 μm.

References

    1. Prasher DC, et al. Primary structure of the Aequorea victoria green-fluorescent protein. Gene. 1992;111:229–233. - PubMed
    1. Chudakov DM, et al. Fluorescent proteins as a toolkit for in vivo imaging. Trends Biotechnol. 2005;23:605–613. - PubMed
    1. Shaner NC, et al. A guide to choosing fluorescent proteins. Nat Methods. 2005;2:905–909. - PubMed
    1. Shaner NC, et al. Advances in fluorescent protein technology. J Cell Sci. 2007;120:4247–4260. - PubMed
    1. Verkhusha VV, Lukyanov KA. The molecular properties and applications of Anthozoa fluorescent proteins and chromoproteins. Nat Biotechnol. 2004;22:289–296. - PubMed

Publication types

MeSH terms

Substances